5 reasons to invest in Data Analytics in times of crisis
In times of major crises, such as the one caused by the COVID-19 Coronavirus, which has impacted the economy worldwide, it is necessary to make quick and effective decisions based on data rather than intuition.

If you ask yourself how is this crisis going to affect my company?, the answer can be very varied, but a common denominator indicates that it is going to depend on the level of digital maturity of your company, not only at the management level but on all the people working in the organization.
We are seeing that there is already a decrease in consumption and presumably it is going to be more pronounced over the weeks. In crisis situations our recommendation is to reinforce investments in the digital channel, because it has proven to be the channel with a high return on investment in times of prosperity, but above all, in times of crisis.
How will Data Analytics help my company?
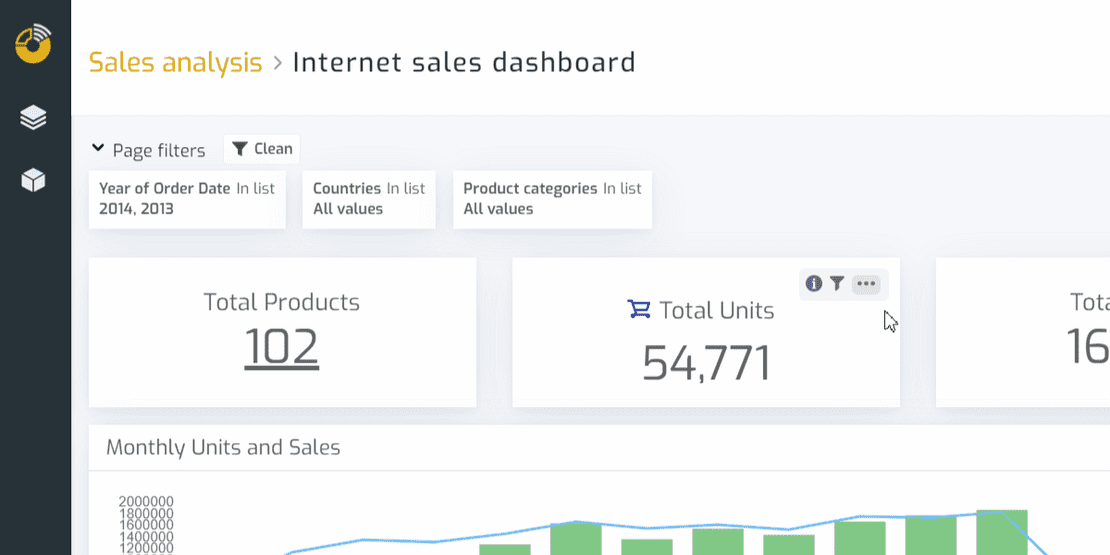
At the business level, having tools to do data analysis is vital for decision making. We can perform this analysis by relying on a platform where we can create data visualizations such as dashboards, graphs, KPIs or maps.
But perhaps the tool is the last link in the chain in a Data Driven company because we must create a data culture in which everyone involved in the company is familiar with working daily with data.
In addition, we must try to ensure that all areas of the company are digitalized, so that each department will generate data periodically that we can then analyze.
Examples of digitalization in our companies can be the use of ERPs for internal management, CRMs for sales management, project management tools, production systems in the industry, sensor readings, etc.
Taking into account the above, these are the 5 ways in which Data Analytics will help your company in this crisis:
1. Saving time
The famous saying that time is money makes a lot of sense when we have to make quick and effective decisions.
By automating data integration processes, we can interconnect all the company's data sources, both internal and external, and store them in a central Data Warehouse that contains historical data. These processes, commonly called ETL processes (Extract, Transform and Load), are vital to ensure that data from all our systems can be analyzed in a data visualization tool.
Each of these data integration processes can be executed automatically and will contain the necessary logic for the calculation of the analysis indicators or KPIs that we have defined in our company.
This automation means that we can be saving a lot of time on management tasks. Tasks that, without automation, could take us days or weeks to complete (for example, the sales closure report for all our commercial subsidiaries) and be executed in a few minutes.
Once we have the data correctly stored in a Data Warehouse we can create the data visualizations in a tool such as Biuwer.
2. Costs reduction
In addition to reducing time in management tasks, which means cost reduction, we can identify areas in our company where we can reduce expenses and become more profitable.
And you may ask yourself, how can I reduce costs?. The first fundamental part, as I mentioned before, is that every department or process in my company is digitalized. In this way we can make an analysis of each department or production process.
For example, in a package delivery system to customers, we can analyze which routes are optimal depending on several factors such as the day and time of delivery, or other factors somewhat more hidden as the state of traffic in those hours. If we have enough data we will be able to configure our delivery routes to be more optimal.
Another example can be found in the industry's production lines. We can detect which parts cause bottlenecks and allocate more resources to this part.
Also in the industrial sector, we will be able to create a predictive model using data on the state of the machinery, which will tell us when we should perform preventive maintenance on this machinery to avoid breakages or inopportune stops.
3. Increase in sales
Another key factor that we can improve through data analytics is the improvement of our sales.
Perhaps in crises as strong as the one experienced with the coronavirus, we cannot do more than soften the drop in sales, but, what if we can open new lines of business by making the right analysis?, or new markets?, or perhaps both?.
An example of this can be found in the opportunity analysis. If we detect an opportunity generated by an external factor, such as a health crisis, we can carry out an analysis of what it means for us to turn our usual production line into the manufacture of health material. In this way, by analyzing the production costs, we can establish the optimal sales prices and determine the profiles of the clients to which to sell, in times of so much demand.
On the other hand we can complete the data generated by your organization with external information and thus complement a partial internal view with what happens in the rest of the world. It is recommended to make an competitive analysis and of those external factors that may affect us (prices of raw materials, purchase intentions, currency exchange rates, etc.).
4. Facilitates internal communication
A Data Driven company that is managed from data must use tools that facilitate communication between workers. And in the data analysis part this is very important since the platform we use must be accessible from anywhere and available at any time.
This is even more important in a crisis like the current one, since remote working is encouraged (and sometimes imposed), which means that the people who have to make decisions need to have the data available and to visualize it correctly from any place.
Fortunately, there are data analysis tools, including Biuwer, called Modern BI that are deployed in the cloud and meet all the requirements of availability, accessibility and security.
An important aspect is that the data visualization platform is secure, so that we can configure access to different reports and dashboards so that certain users or groups of users do not access sensitive data or protected information.
5. What is not measured cannot be improved
It's a very popular phrase, but it's absolutely true. It happens in all areas of life, in business, in sports, in health (especially in this crisis of the Coronavirus COVID-19).
If you want to improve your organization to achieve the goals you set, today, in April 2020, with all the competition we all have and with the digital tools everybody can use, you can not afford not to work daily with data. You should measure everything that is important in order to act quickly.
Therefore, the message we want to give you is the following: if you have not digitized your processes, your company, your department, whatever you are doing, you should do it urgently, because your competition and in general any new project, is already doing it, or it was simply born data driven.
How do I do it? Use digital tools that generate or store data: ERPs, CRMs, cloud applications with APIs, databases, data files (CSV, Excel), etc. These are your data sources, which you will be able to analyse interactively by taking the information to all the necessary people through a data analytics platform.
Biuwer helps you with a free Quick Start Package
Not every company has the resources, experience or knowledge to implement a Data Analytics solution. Included in our Annual Professional Plan, Biuwer's data engineers will work with you to do the following:
- Joint session to identify the most important needs and those that are urgent. As well as learning about the available data sources and defining the next steps.
- Connection to the data sources, with the definition of the data models (analysis dimensions, key indicators, necessary intermediate calculations).
- Assembly of the first reports and dashboards in Biuwer, including the interactive filters.
- Setting up access security, registering key users and configuring access to the data to be analysed.
Biuwer helps you make decisions based on data in the form of visualizations, charts or dashboards. In addition, the platform is compatible with Big Data systems such as Google BigQuery, which allows you to incorporate predictions into the data based on a series of learning models using Machine Learning.
If you are interested write us and we will get to work as soon as possible.