Product updates
June 2024
New functionalities:
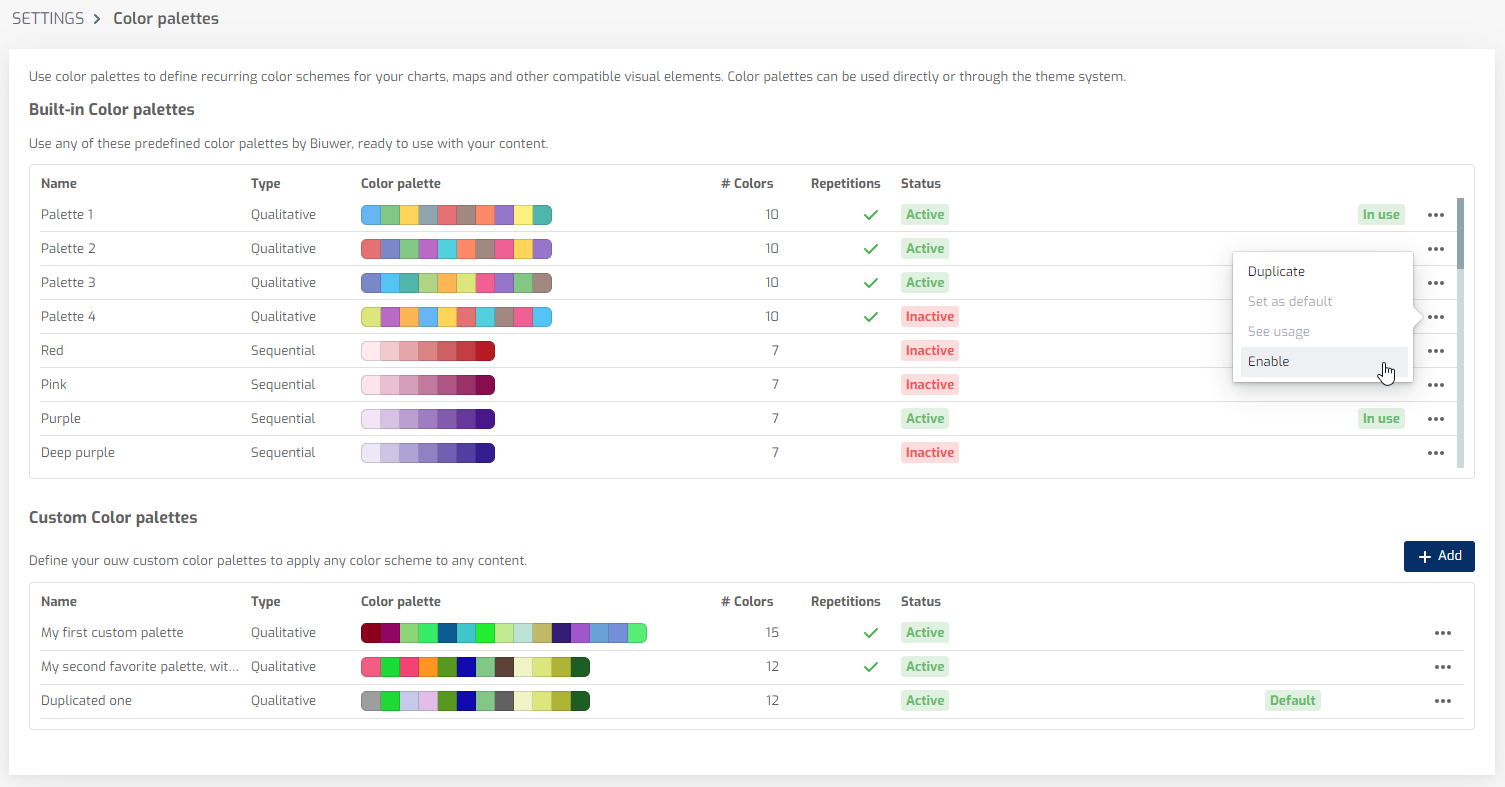
- New Color Palette system. We include in this update one of the most practical features that you have requested from us in recent months. From now on, you have at your disposal 32 predefined color palettes ready to use in content cards, such as Charts or Maps. You can also create your own custom color palettes, to apply the necessary color combinations.
We invite you to discover all the options we have enabled, which include: easily and accurately configure qualitative, sequential and divergent color palettes; set a default color palette; enable or disable color palettes for later use; know what color palettes are in use.
Soon the color palettes will also be integrated with Themes, so that color schemes are assigned automatically depending on the themes applied to the content.
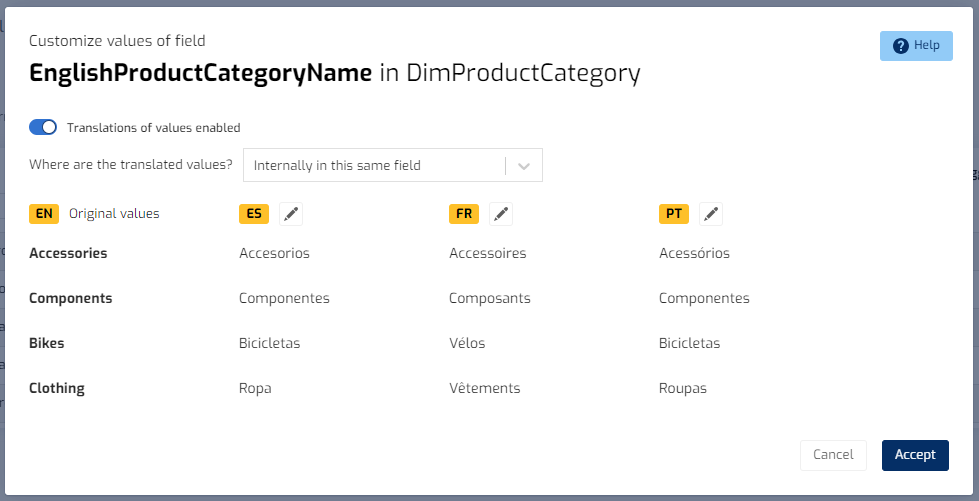
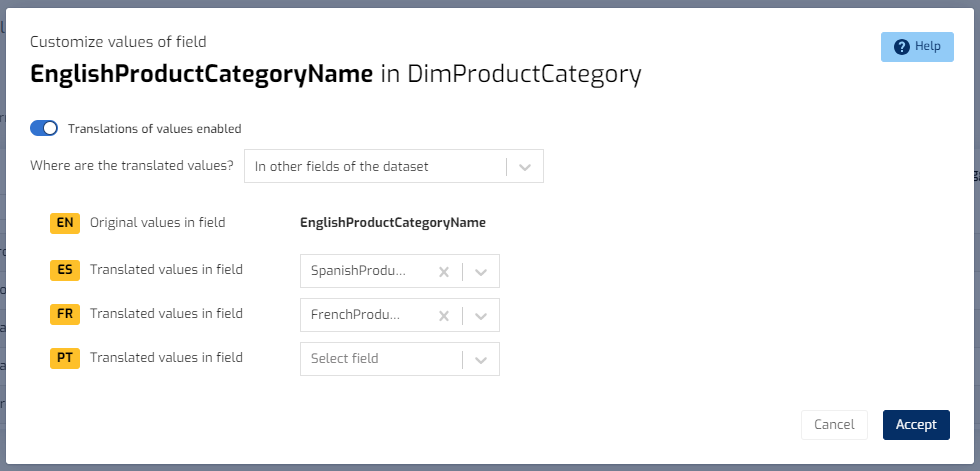
- Translations of data fields, included in the Multi-Language system. This new functionality allows you to complete the multi-language content translation system by allowing you to customize the values of the data fields. With this new functionality you will be able to include translations in the categorization fields and other attributes, to show in the Legends and Tooltips of Charts and in the Filters system, the different values translated into the language that the end user is using.
Improvements:
-
Empty text string is now allowed in filter expressions. This functionality improvement is an example of your direct feedback as users. Added the ability to not have to include a “non-empty” text value in filter expressions. In this way, end users have more flexibility to indicate a value or not, allowing that in the absence of a value it is as if the filter is not applied at all.
-
Improved the performance of lists of objects. The management of hundreds or thousands of objects (cards, users, etc.) makes the lists increasingly heavy. We have included a series of improvements in visual and object search performance, which for those of you who have spaces with hundreds of cards and manage hundreds or thousands of users in Biuwer, will make your work faster and more efficient.
-
Improvements in the Google Ads connector, incorporating new entities and fields, such as objectives, conversion actions and campaign types, and checking the indicators in detail (clicks, impressions, cost, etc.).
-
The MAX_VALUE and MIN_VALUE functions used in Card calculated fields can now incorporate 2 or more parameters (fields or expressions). This improves the possibility of calculating maximums or minimums at the row level, with multiple fields involved.
-
The operation of the PREV_PERIOD function in the calculated Card fields has been adjusted so that it includes in all cases the same date level as the configured one.
-
Due to high demand, since this update we have included the following limitations for automatic data updates, in Application type connections (for example, Google Ads, Notion, Holded or Pipedrive). The basic plan is limited to updates every 7 days, the standard plan every 24 hours, the professional plan every 1 hour, and the enterprise plan every 15 minutes.
Bug fixes:
-
Fixed the parsing of expressions in Calculated Fields of Datasets, which in some cases caused the internal identifier of the field to be displayed in the result.
-
Fixed the error reported when editing REST API type connections, which prevented adding more parameters to those previously configured.
-
Fixed problem reported with "Related data" in some multi-query cards.
-
Fixed the problem reported with the “Information” icon when placed on the cards, even if it did not contain a Description to display.
-
The counter for rows displayed on Vertical Table cards is now reset when page filters are applied.
-
Other minor fixes.
April 2024
New functionalities:
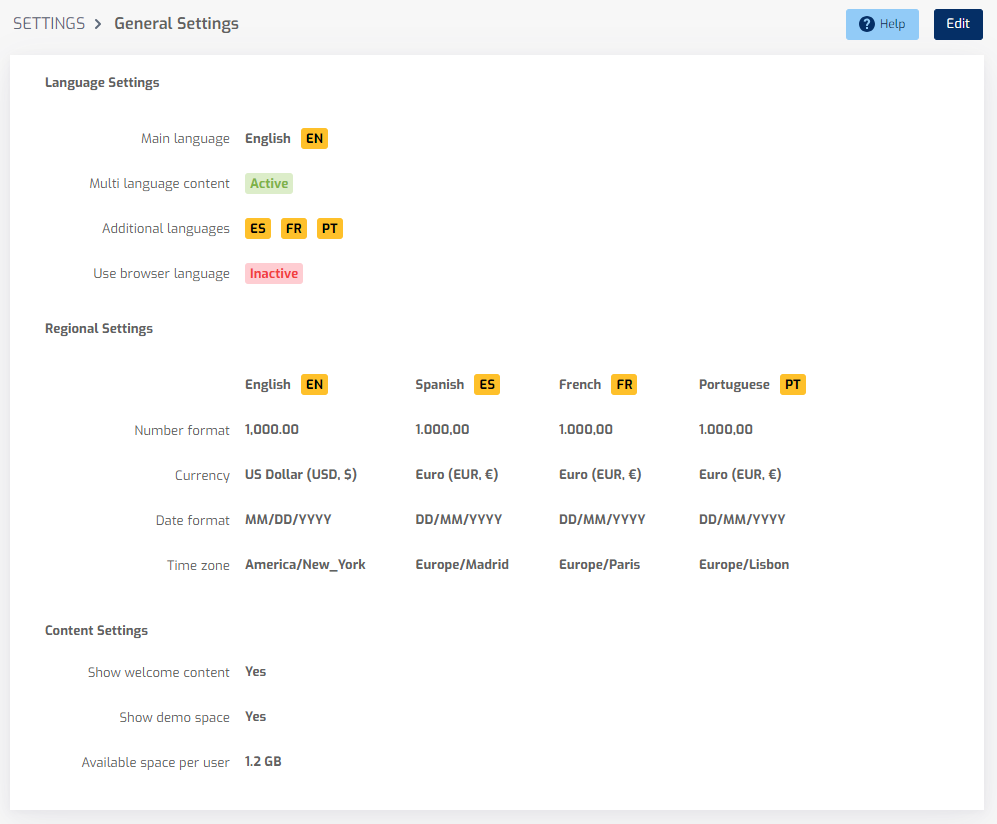
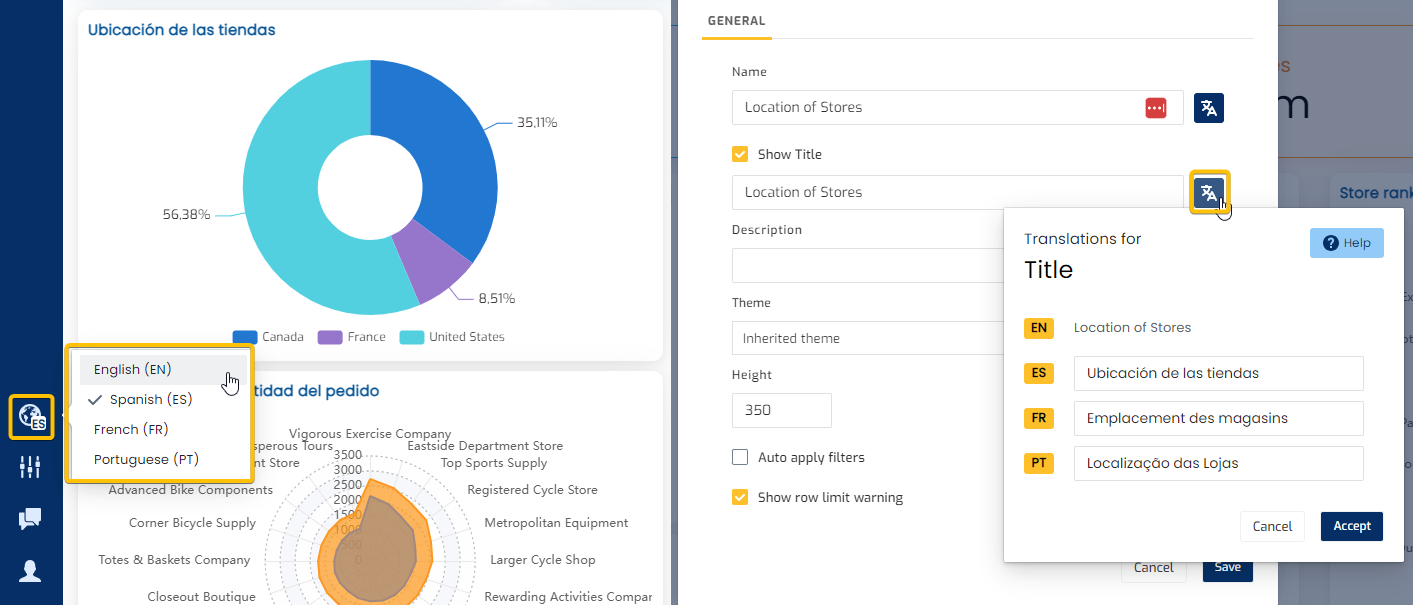
- Multi-language system for Contents. If you have users from different countries in your software or SaaS who consume content and data in different languages, this functionality is of interest to you. Since this update, Biuwer includes a complete system to manage multiple languages and translate content. Available in the Professional plan, it allows you to add all the necessary languages and specify the translations intuitively, as shown in the following images. Translations for data fields (Text type dimensions) will also be included soon, for a complete experience. We start with a configuration of the multi-language functionality in the Administration area of your Organization, and then use the language switcher interactively to check the translations you are making, for which we have included a translation button in each field so that you can specify the texts for each configured language.

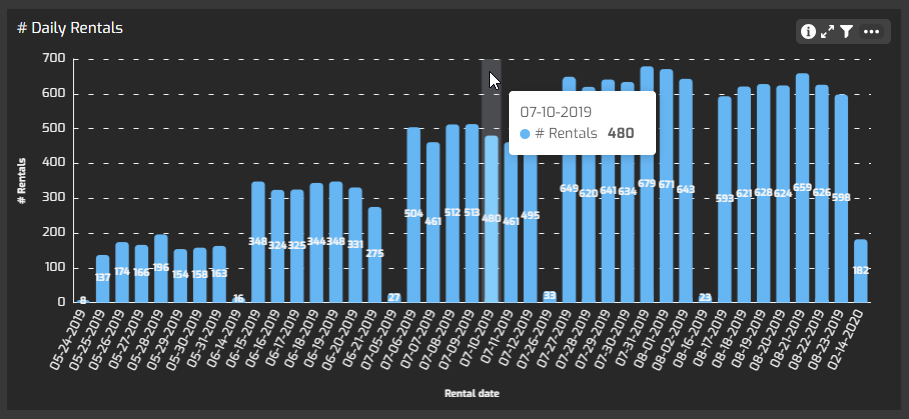
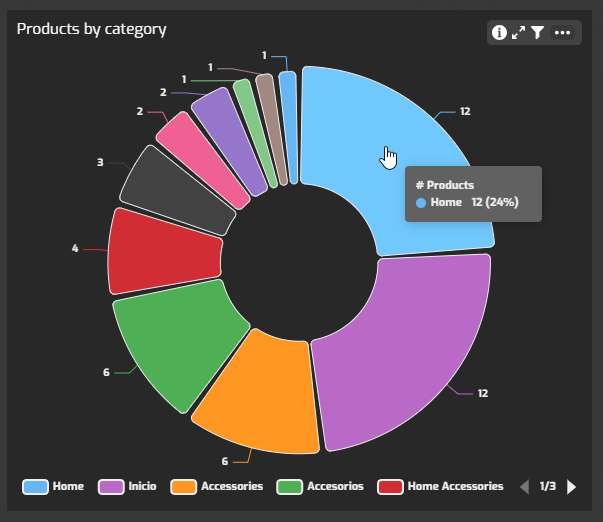
- New styling options on chart cards, to fully fit any theme (light or dark). Multiple options have been included to configure visual aspects on chart cards, such as axis colors, element borders (including rounded corners), and even legend colors. Using all of these options, you can configure your charts to display attractively with dark themes and backgrounds, like the examples below.
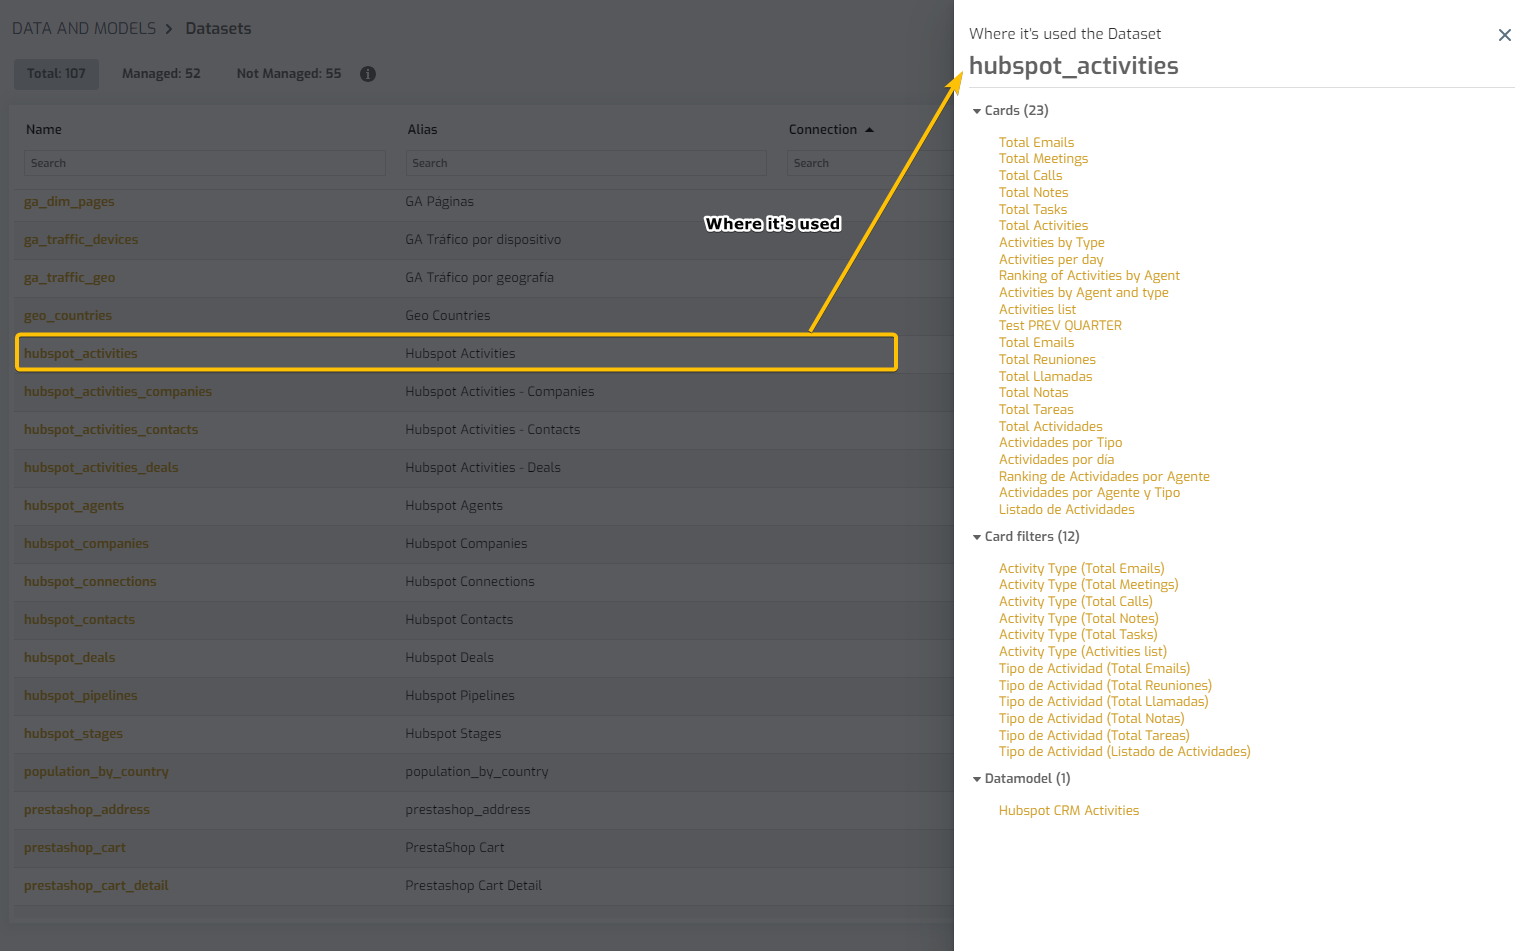
- Visual object usage traceability. This is a recently highly requested functionality, very useful for those organizations that exceed 1000 content objects. In Biuwer we have included our many years of experience working with data analysis tools and one of the characteristics is the long-term management of content, data and security, and for this it is necessary to have tools to be able to put things in order. which can easily turn into chaos. Object usage traceability allows users to know where each object they want is being used in Biuwer, and is available in Spaces and in the Data Center. Access the new side panel by clicking on the “Where it’s used” option in the contextual menus.
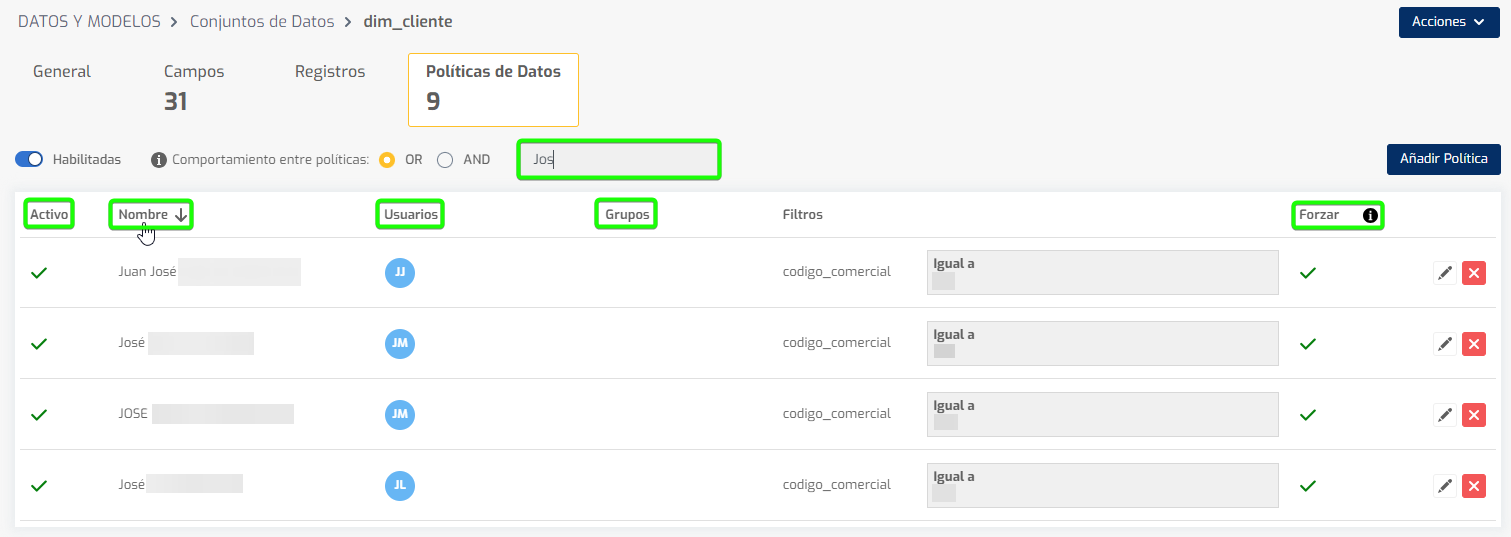
- Search and sort Data Policies. Easily manage hundreds or thousands of your Data Policies across Data Sets, using the new interactive search and sort. Now you can easily locate which policies affect each user or group, check if a policy exists and is correctly configured, etc.
Improvements:
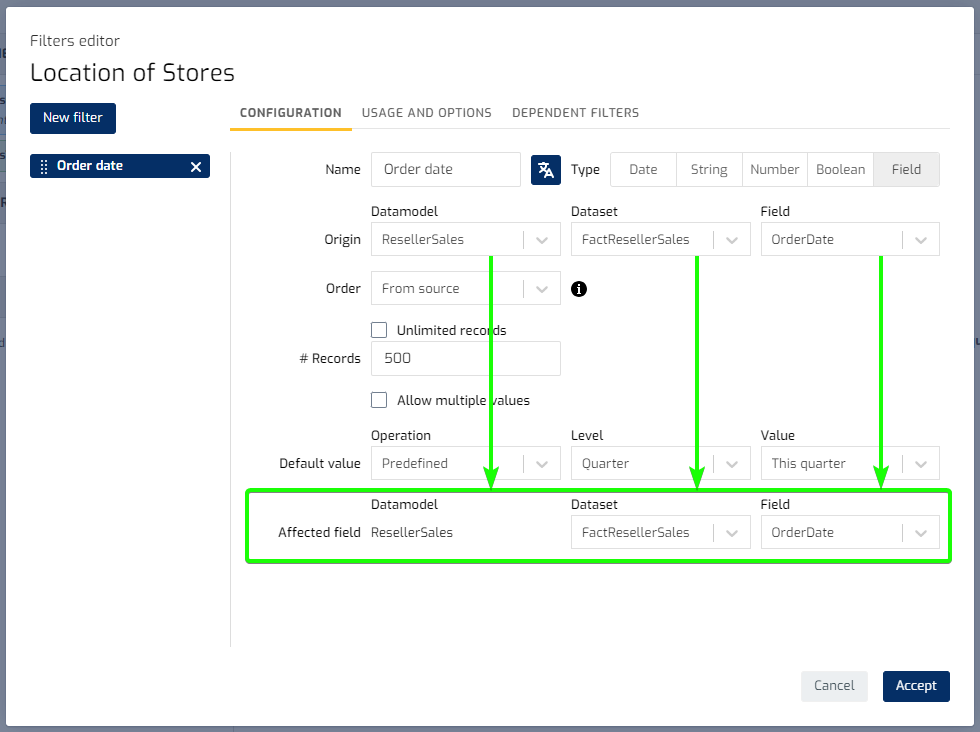
- Intelligent autocompletion of Filter values. Another request that you have asked us is to try to auto-complete the field filters with the correct configuration automatically. This autocomplete is available in card filters and page filters. In the first case it is much simpler, since the assignment of Model, Data Set and Field is unique (as can be seen in the following example), and in the case of pages it can be more complicated due to the different filtering cases configured in each case. However, in queries with the same Model as the one configured in the filter, autocompletion will be carried out automatically, which in any case you can always adjust.
-
Improvements in data export. The data export system has been evolved to allow very large data files, over 100MB, to be downloaded much more quickly. Interactive filters are also taken into account in Vertical Table cards, so that when exporting data after having filtered interactively, exactly the data shown in the table is exported and in the same configured order. Last, but not least, when exporting data to Excel files, the fields that are Dates will be exported as such, that is, Excel automatically treats them as Dates (and not as texts).
-
Improvements to the data card editor. We've tweaked some details to make the process of dragging and dropping fields easier and more intuitive. The "Show records without value" option is also displayed only when it makes sense, that is, if the query generated by the Biuwer query engine involves more than one Dataset with Joins. This option "Show records without value" is also available with Data Models from connections managed by Biuwer.
-
Performance improvement in the Facebook Ads connector. We have included improvements to the data processing included with the Facebook Ads connector, to allow data from accounts with high ad usage on the social network to be synchronized.
-
Expanded the error messages shown to the user when executing queries. The total characters displayed have been expanded for error messages displayed to the user.
Bug fixes:
-
Check type selectors. In some cases it could happen that these selectors were displayed incorrectly, but we have replaced the visual component with an improved version to avoid this problem, which is also more elegant and minimalist. 🙂
-
Fixed an error detected in radar charts.
-
In the process of uploading CSV files, a potential error detected for records with null values has been corrected.
-
Other minor fixes.
March 2024
New functionalities:
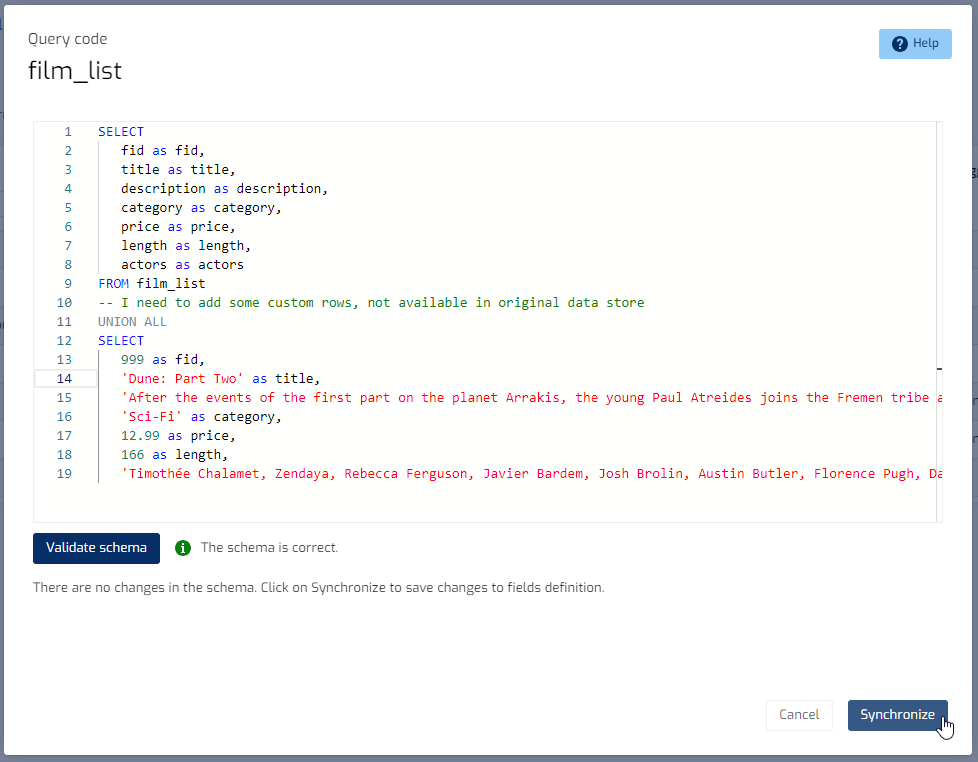
- Datasets defined as Views. Datasets in Biuwer are the starting point for the query engine to do its job and obtain data to display in visualizations. Until now, the definition of Datasets could be done manually (incorporating fields one by one) or using the Reverse Engineering utility, very useful to access the definition of tables and data views quickly and easily. However, there are cases in which to implement more complex data logic, it is required to code queries typically using SQL, which implement the necessary calculations, aggregations, and logic. Given this, a solution is to create views defined using SQL physically in the source database. There are cases in which this is not possible, for various reasons, and others in which the calculation logic may change. Since this update, views can now be defined in Biuwer, without having to touch the source database. The most interesting thing is that this allows a lot of flexibility, since a Dataset can be started without being a View and change to a View and evolve over time (and vice versa).
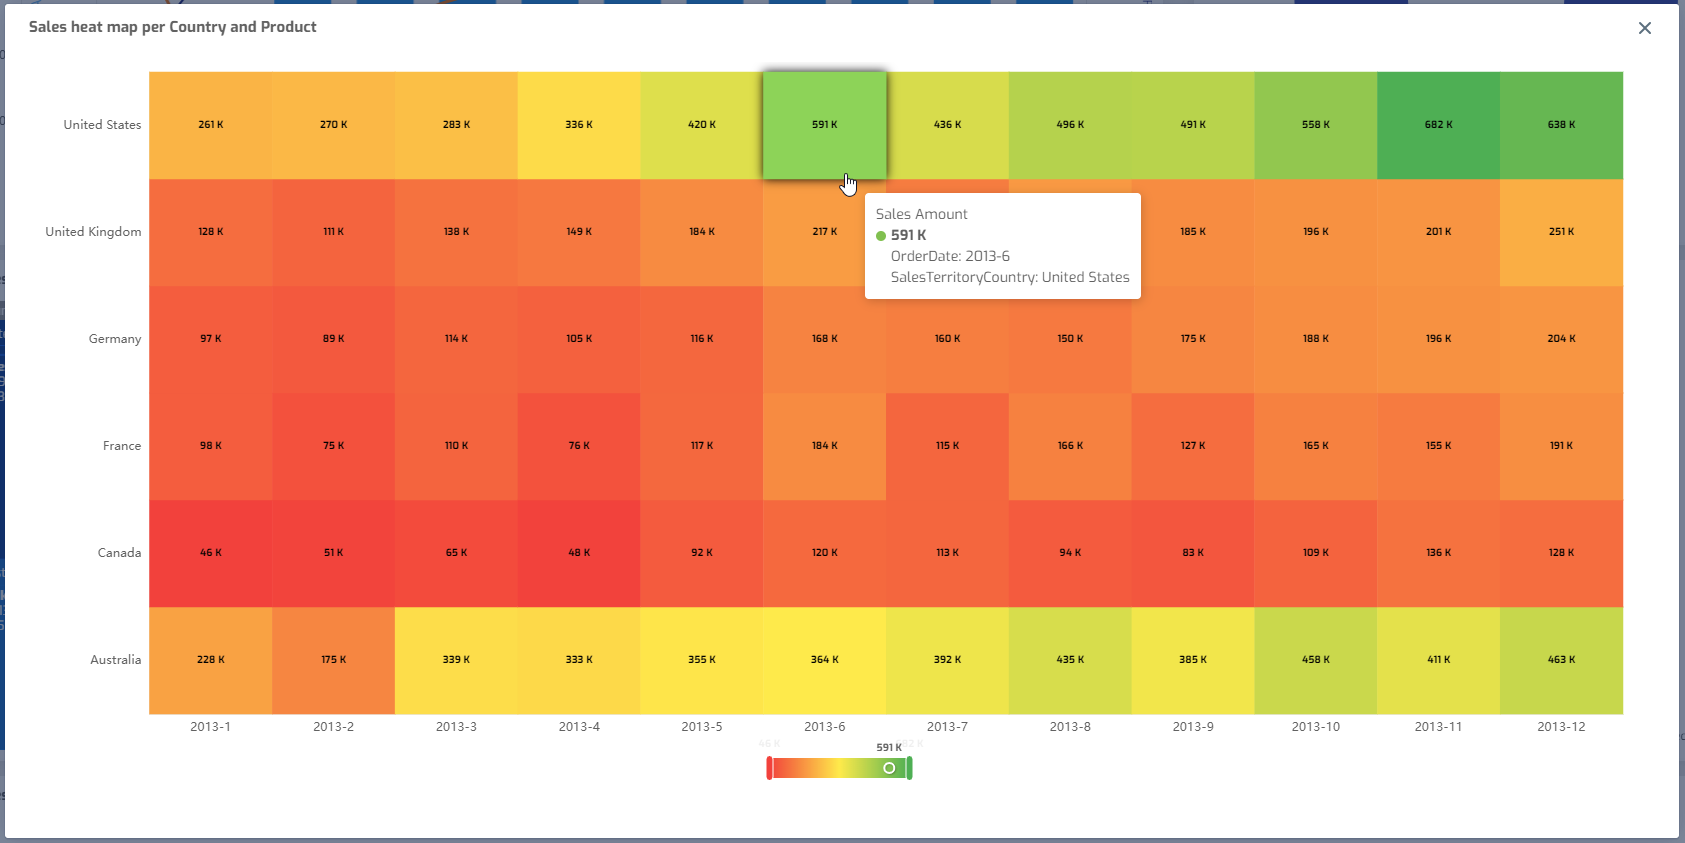
- New Heat Map chart. A heat map is a two-dimensional representation of data in which various values are represented by colors. A heat map provides an immediate visual summary of information on two axes, allowing users to quickly grasp the most important or relevant data points. Therefore, the heat map chart is one of the most useful and powerful data analysis tools in Business Intelligence. Provides a visualization function that presents multiple pieces of data in a way that makes immediate sense by assigning them a different color. This is why heat maps are suitable for visualizing large amounts of multidimensional data and can be used to identify groups of rows with similar values, as they are displayed as areas of similar color. You can use them with different color palettes as shown in the example below. The chart has a legend with gradient colors that interactively shows the current value and also allows you to interactively filter the values to be displayed on the graph.
- Limit of values displayed on chart type cards. This new functionality is very interesting to be able to show the values in which we are interested, taking into account the ordering configured in the data. It is typically used in pie charts where it is interesting to have a limited number of values so that the user can understand the most prominent values and with the option of showing the rest of the values grouped into one value.

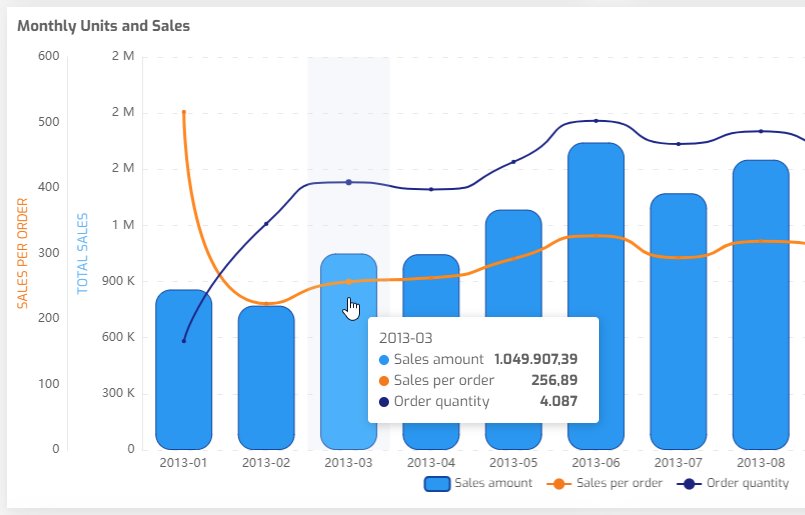
- Rounded corners on chart cards. Another novelty in the Biuwer charting system allows, from this update, to configure rounded corners, apply borders and different styles. This can be useful to display a more “round” style to your charts, for example bar charts or pie charts.
Improvements:
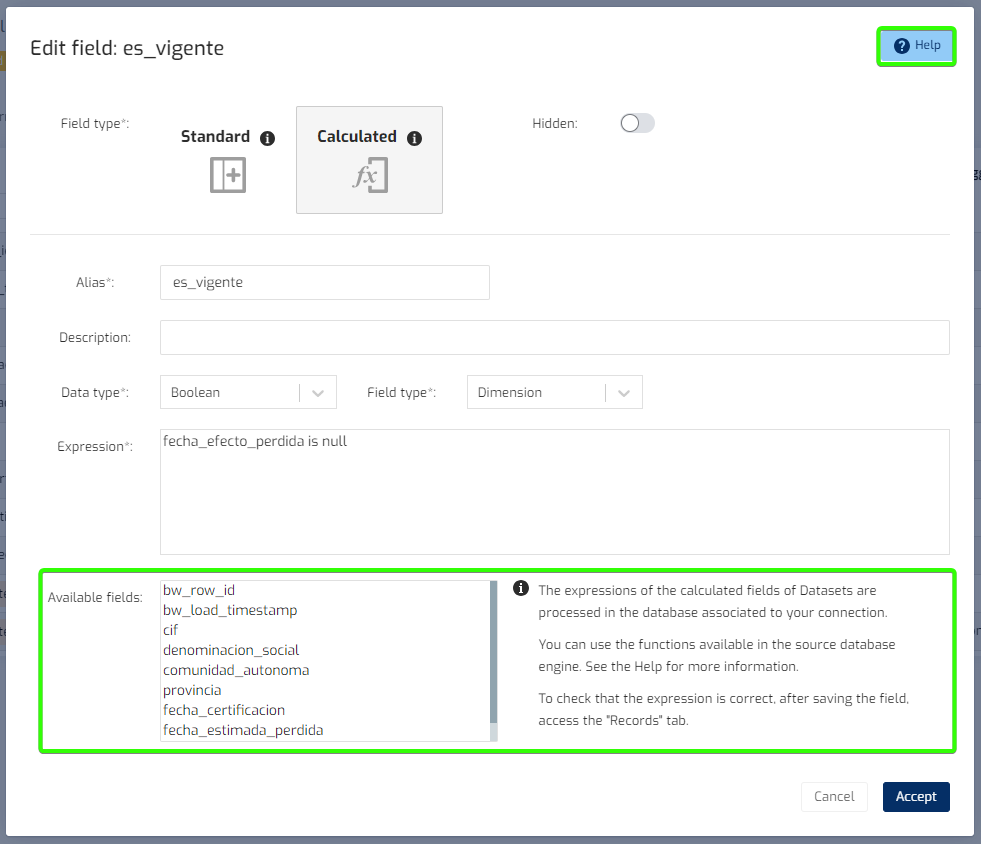
- Improvement in the Dataset calculated fields dialog, which includes an explanation of how it works and a link to the help page (Biuwer Docs). As indicated on the screen, the expressions of the Dataset calculated fields are processed in the database associated with their connection, for which you can use the functions available in the source database engine. That is, if, for example, the source database is PostgreSQL or Clickhouse, consult its official documentation to select the functions to include in the expression of the calculated field.
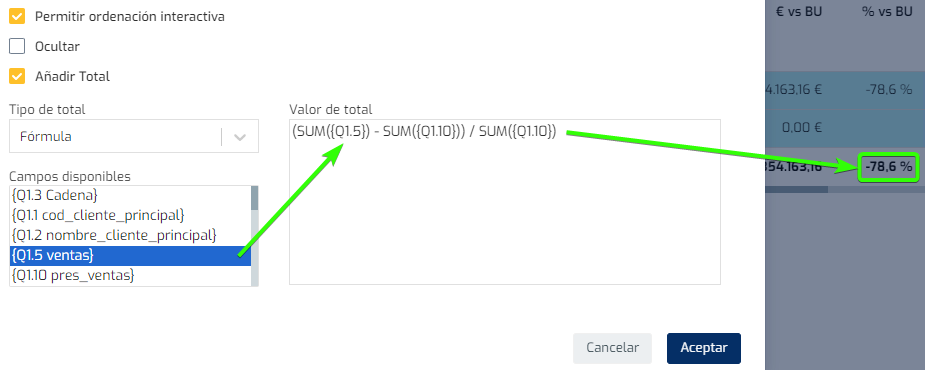
- The expressions of the formulas included in totals on cards have been homogenized, with the same syntax used by the card calculated fields.
-
Joins with calculated Dataset fields. The Biuwer query engine has been improved to be able to include calculated fields that you define in the datasets, in the fields involved in “joins”. In this way, regardless of the expression of the calculated field, the Biuwer query engine will include it using the unique identifier of the Dataset as an alias.
-
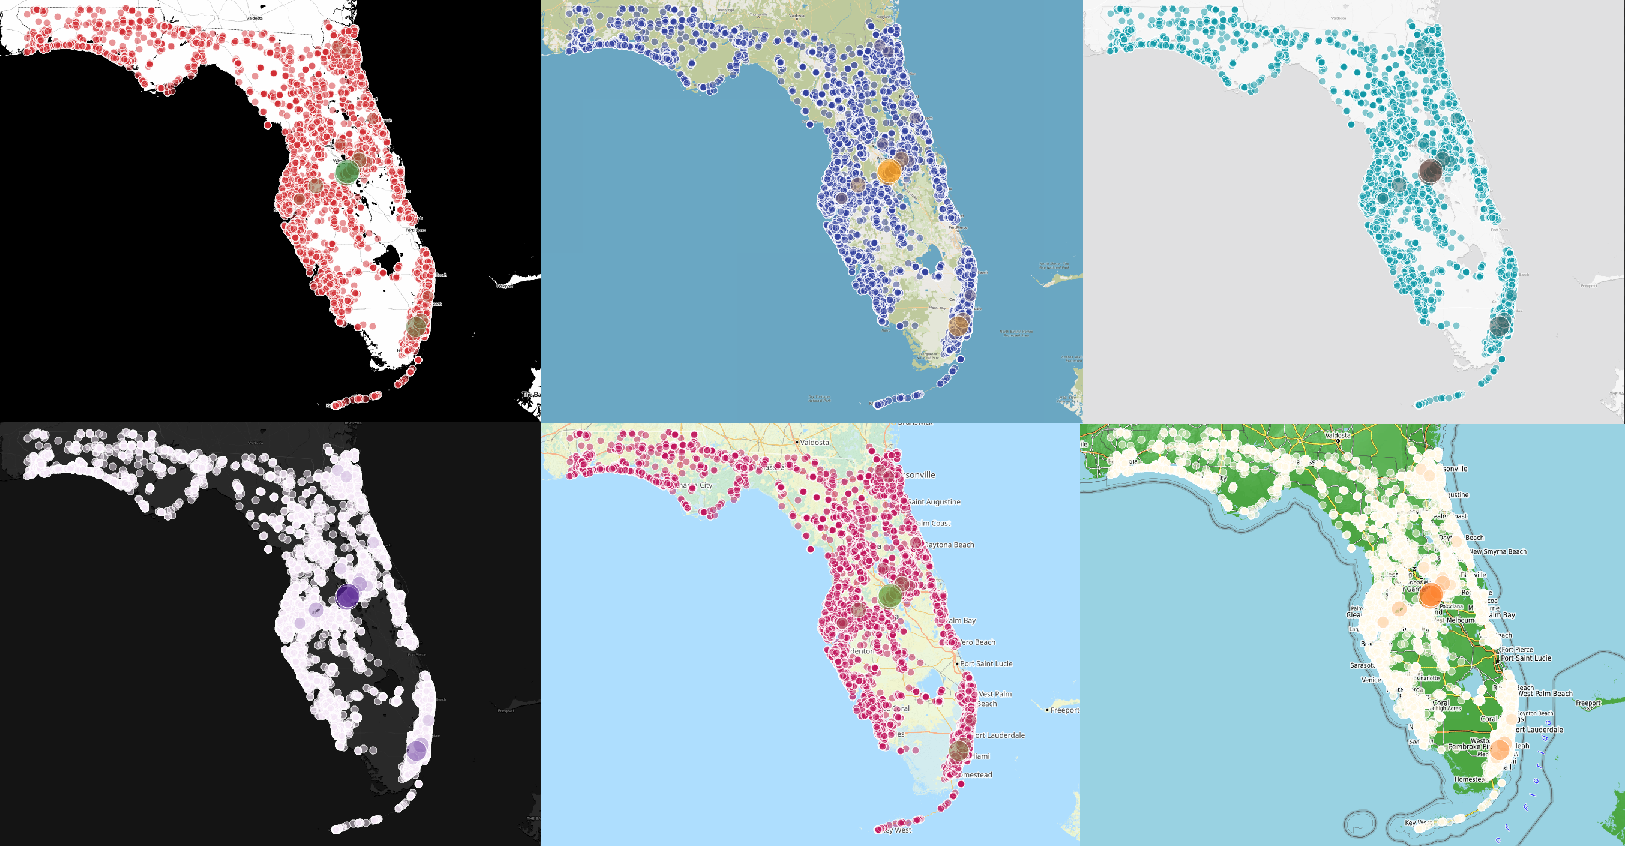
Map cards now include 7 new basemap types. When it comes to maps, a picture is worth a thousand words. We show an example of bubble maps on insured real estate properties in Florida, United States, taking six of the available variants as a base map. Imagination to adapt the result to your application!
-
The Row Limit Reached warning is configurable on each page or card. Until now, if a maximum number of records was configured and it was reached, a visual warning was always displayed to inform the user of this fact. Now you can configure whether or not to show this notice to your users. This notice will always be displayed in the Data Card Editor.
-
The list of shared spaces has been visually improved, so that when there are so many that a vertical scroll appears, the entire available space is used.
-
A warning has been included in case of query error in the data preview of a Dataset, in the Records tab. This error message is especially useful if you are working with views and calculated fields that may have some syntax errors that need to be resolved.
Bug fixes:
-
Solution to problem reported when clicking on column to sort in “Related Data” of the Card Editor, which did not show data.
-
Connection setting to Facebook Ads.
-
Adjustment in crosstab card, subtotals did not add up with NULL values involved.
-
Adjustment of color calculation in choropleth maps, to correctly differentiate between different buckets.
-
Other minor fixes.
January 2024
New functionalities:
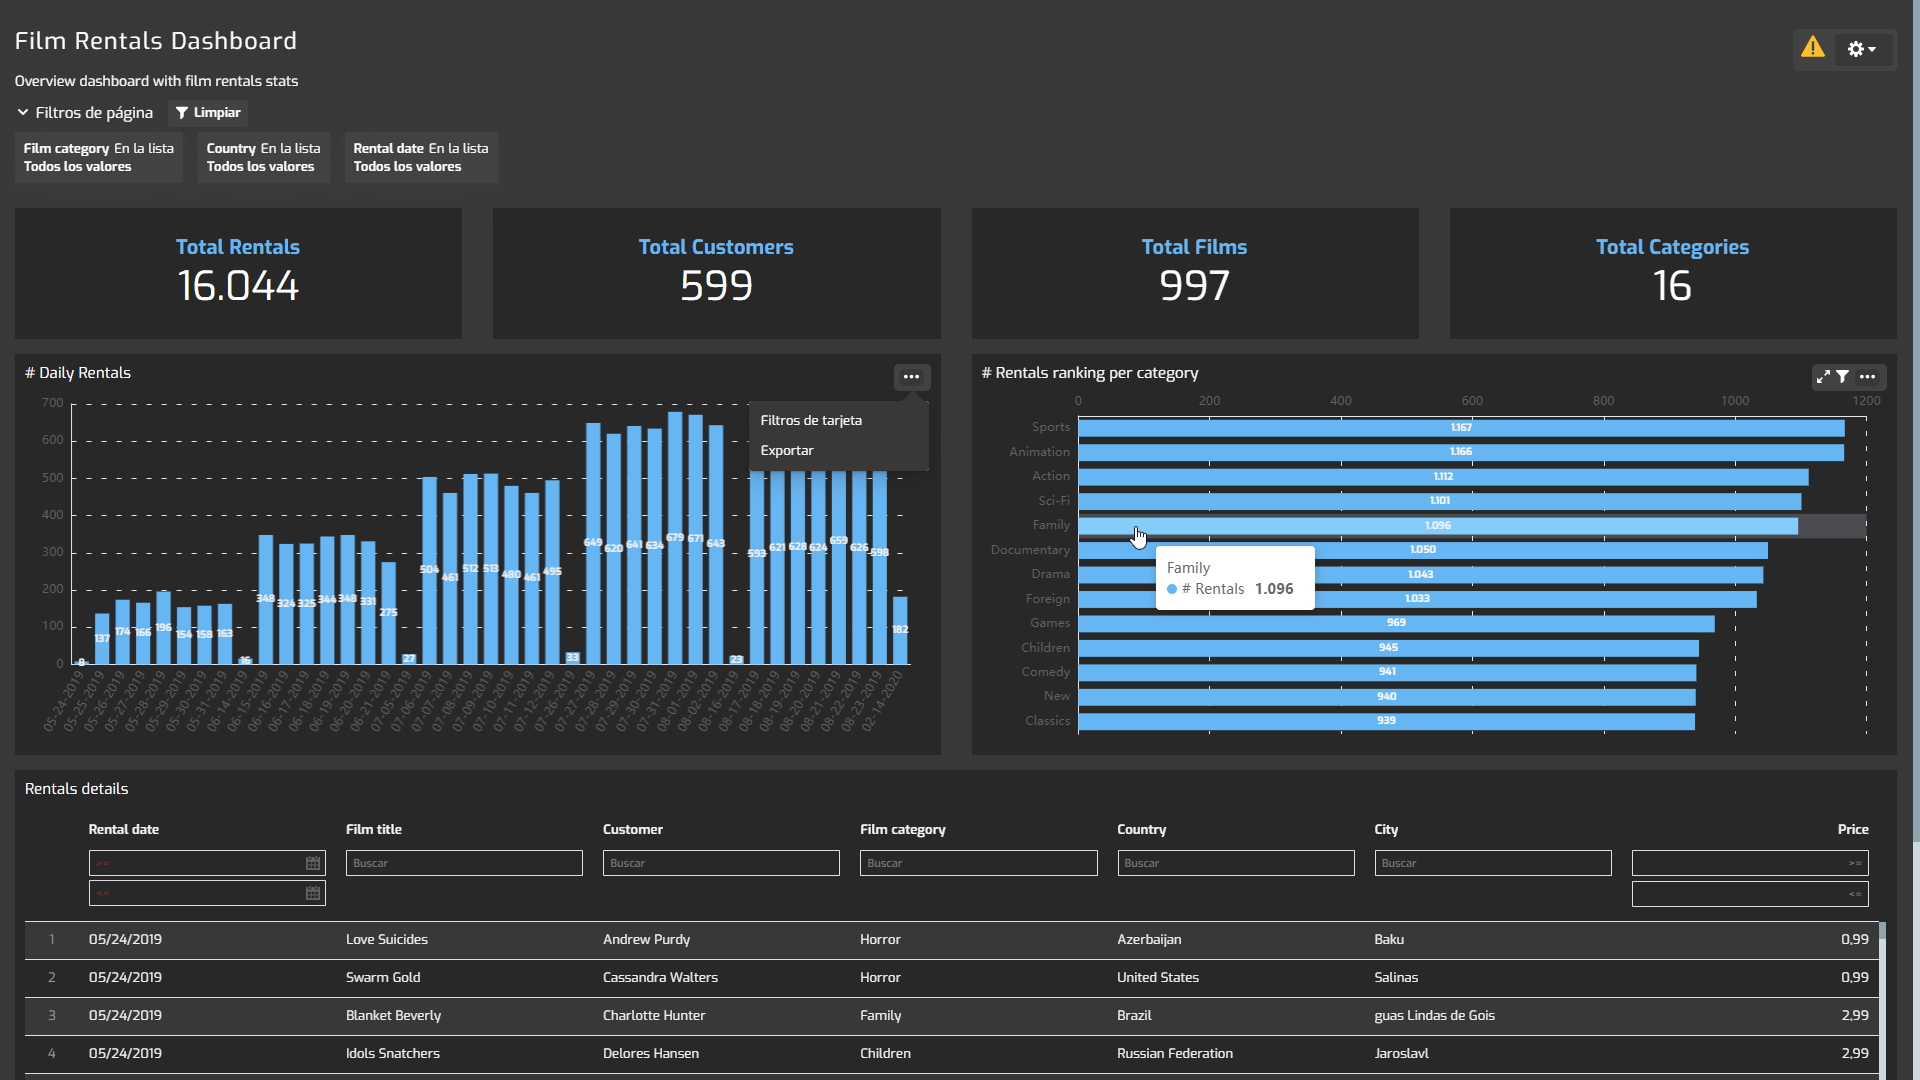
- New dark theme available. Within the set of predefined themes offered by Biuwer, we are launching a new dark theme, built using gray tones. We show you an example panel below. Soon we will create new themes with other shades, both light and dark so you can choose. Remember that you can create your own custom themes to apply the styles you need for your application.
- Biuwer obtains the Cloud Application Security Assessment (CASA) certification from the App Defense Alliance. In our continued commitment to providing our clients and users with a secure and fast data platform, we have certified Biuwer following the more than 100 technical requirements, contained in the 14 security categories, validated by the Application Security Verification Standard (ASVS) of the recognized Open Web Application Security Project (OWASP).
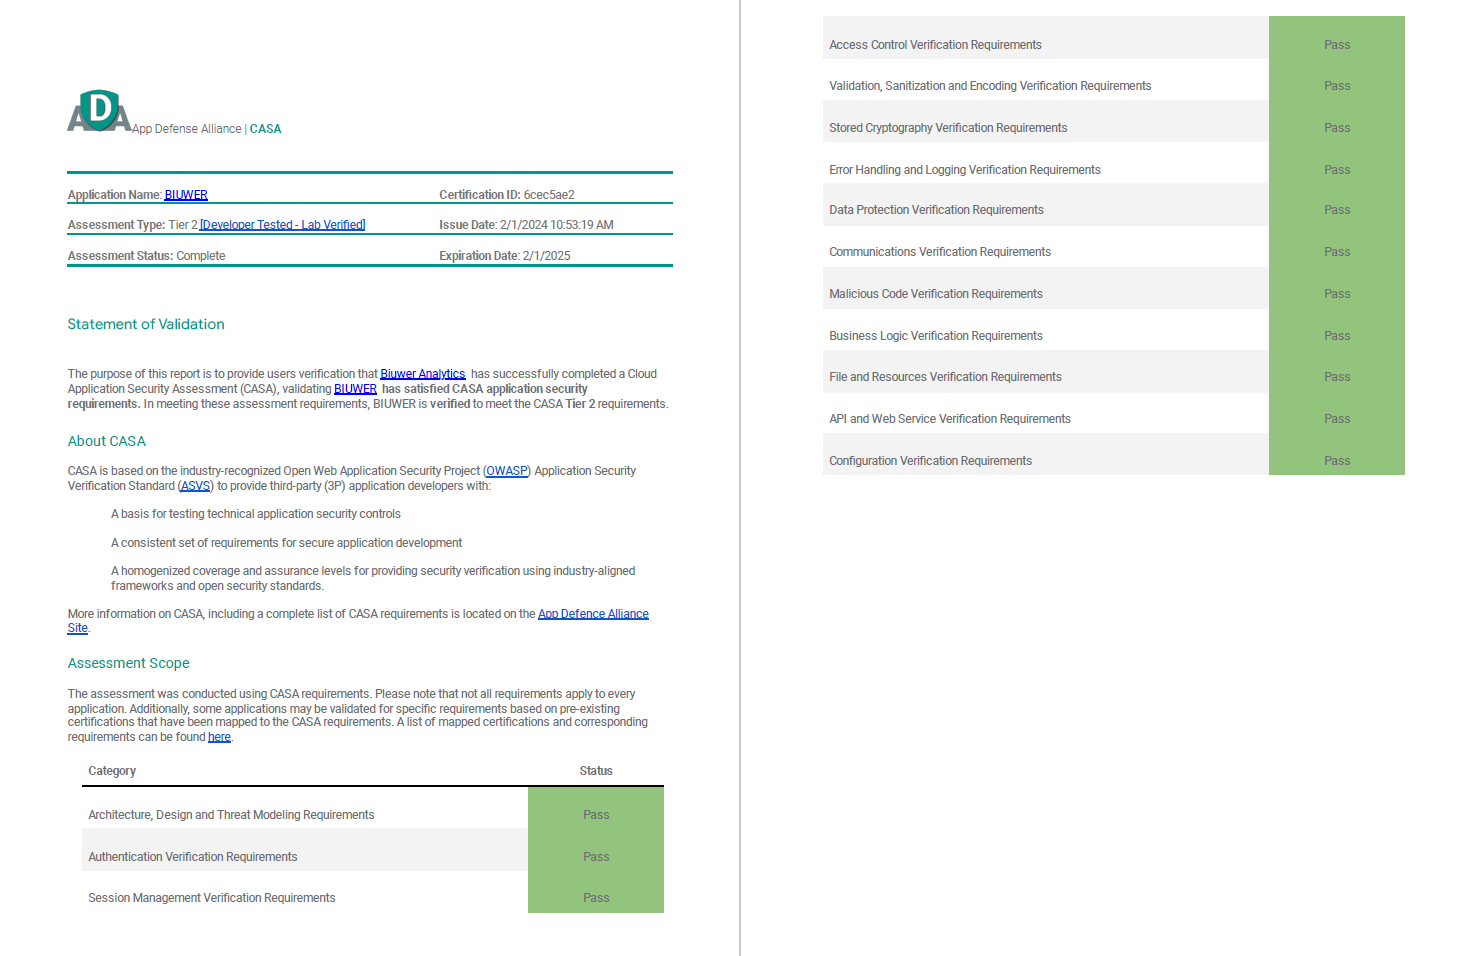
This certification is based on identifying and addressing specific vulnerabilities in cloud-based applications, ensuring that the platform is protected against known and evolving security threats, and maintaining compliance year after year.
Due to the necessary interoperability between different platforms and services, this certification strengthens cloud-to-cloud integrations, particularly those that handle confidential data, and protects user data, according to the most recognized security standards in the world.
Improvements:
- New option to control the application of Data Policies, using AND / OR logic. From now on, advanced users with access to the Data Center can configure the behavior between different data policies that can be applied to the same user, directly or through user groups.
Until now, an OR logic was always applied, that is, results are returned that meet any of the filters that affect each user. With this improvement, you can choose an AND logic, that is, results are returned that meet all the filters that affect each user.

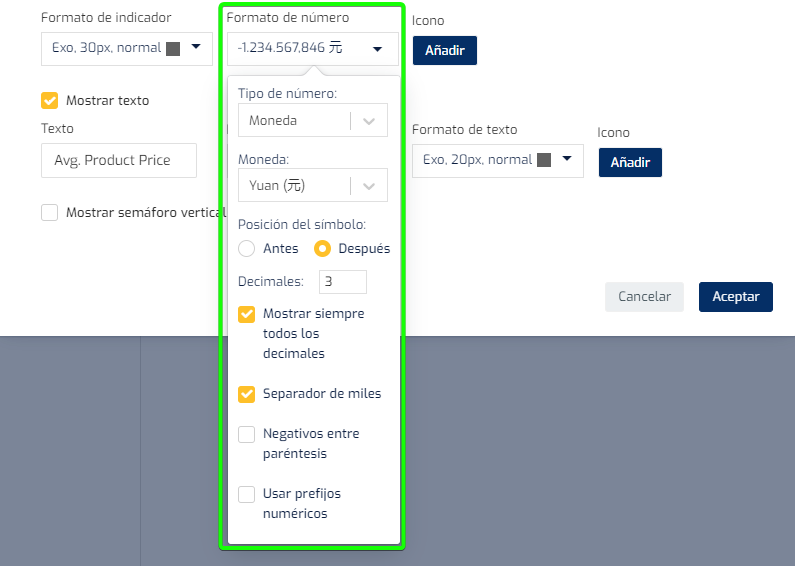
- The number format configuration component has been improved to make it easier to see the final result as the format is configured on the screen. We have also included new currencies. The Euro (€), the Dollar ($), the Pound Sterling (£), the Japanese Yen (¥) and the Chinese Yuan (元) are now available. We show an example below.
-
We have improved the “Test Connection” notification error, to make it easier to troubleshoot initial connection setup. Typically, these initial errors may be due to lack of network connectivity or lack of access permissions.
-
The Google Ads connector has been updated to the latest version of the Google API.
-
Improved support for different data types with the Google BigQuery connector.
-
We have updated the local browser cache time to 30 minutes for all organizations. We will soon include the option for you to accurately configure data cache times for your specific needs.
-
We have updated the conditions during the trial period, so that new companies can test the features of Biuwer, as if they had purchased the Professional plan.
Bug fixes:
-
Solution for the ordering of values in chart cards over Google BigQuery connection.
-
Solution to error reported about a card with multiple KPIs using multiple queries.
-
An additional text parsing has been included before applying string functions, to prevent rare errors reported due to changing data types in data sources and not having synchronized them in Biuwer.
-
Minor adjustments in API Keys screen in the admin area.
-
Adjustment on some symbols for point map cards, using longitude and latitude.
-
Other minor fixes.
December 2023
New functionalities:
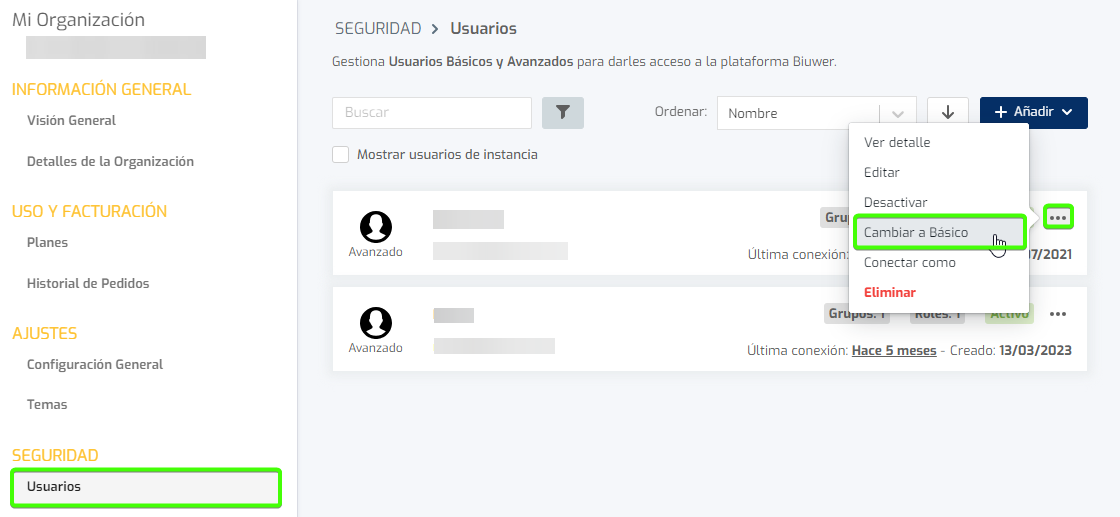
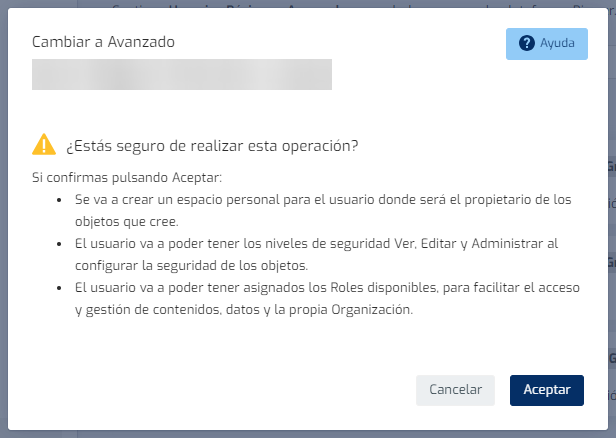
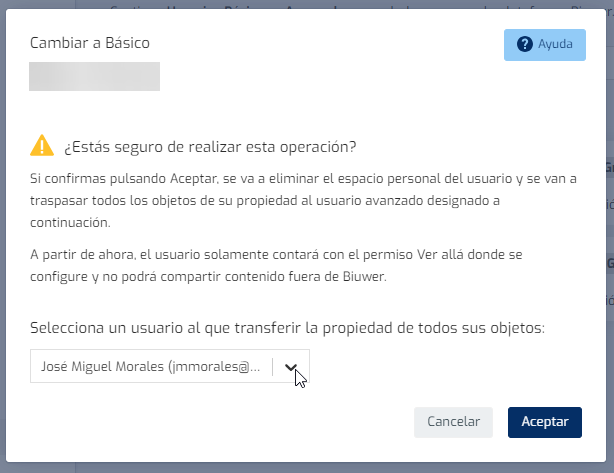
- Switch user type between Advanced and Basic. In order to facilitate better management of users and how they interact with data, a simple functionality has been incorporated so that administrators can switch between the two types of users available in Biuwer. In the two possible changes, a dialog is shown to the user, explaining the changes that are going to occur.
Improvements:
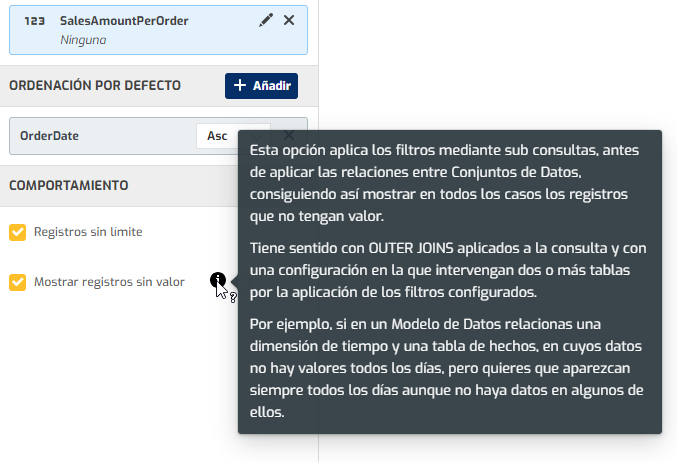
- Improved the "Show records without value" option in the Card Editor. This option is useful in some complex use cases that involve OUTER JOINs in a query on a data source. This option applies the filters through subqueries, before applying the relationships between Data Sets, thus managing to display the records that have no value in all cases. As we say, it makes sense with OUTER JOINS applied to the query and with a configuration in which two or more tables are involved due to the application of the configured filters. For example, if a Data Model relates a time dimension and a fact table, in whose data there are no values every day, but you want them to always appear every day even if there is no data in some of them.
-
Usability improvements on the subscription payment screen using payment link.
-
Improved usability of checkboxes in all forms on the platform.
-
Improvements in management of recurring credit card payments through Stripe, to minimize authentication requirements through 3D Secure.
-
PREV_XXX functions (for example, PREV_YEAR) are supported in the Card Editor to work with two identical fields for which a different aggregation function has been configured in a query.
-
Labels in chart legends are improved to display them correctly in case of a match between multiple fields.
Bug fixes:
-
Fixed problem reported with the actions contextual menu, which was displayed vertically scrolled in some cases with table cards.
-
Solution to Year-Week format in some charts.
-
Adjusted some data type changes in the Card Editor that were incorrect, for example, when calculating an aggregation (e.g. MAX, MIN) on a date field the result is now kept as a date.
-
Other minor fixes.
November 2023
New functionalities:
- New system of custom styles through Themes. Without a doubt, one of the great features of Biuwer in 2023 are the new Themes that allow you to visually customize the styles of a multitude of details in the panels and visualizations used by your users. Following the modular and incremental philosophy that we incorporate into Biuwer, organizations can use both the predefined themes that we offer from Biuwer, as well as the custom themes that you define for your Organization, configuring colors, fonts, borders, etc to the different visual elements that are built in Biuwer. The interesting thing about the new themes is that they are “composable”, that is, different themes can be defined to apply different styles cumulatively to the different levels of Biuwer content (Spaces, Collections, Pages, Cards).
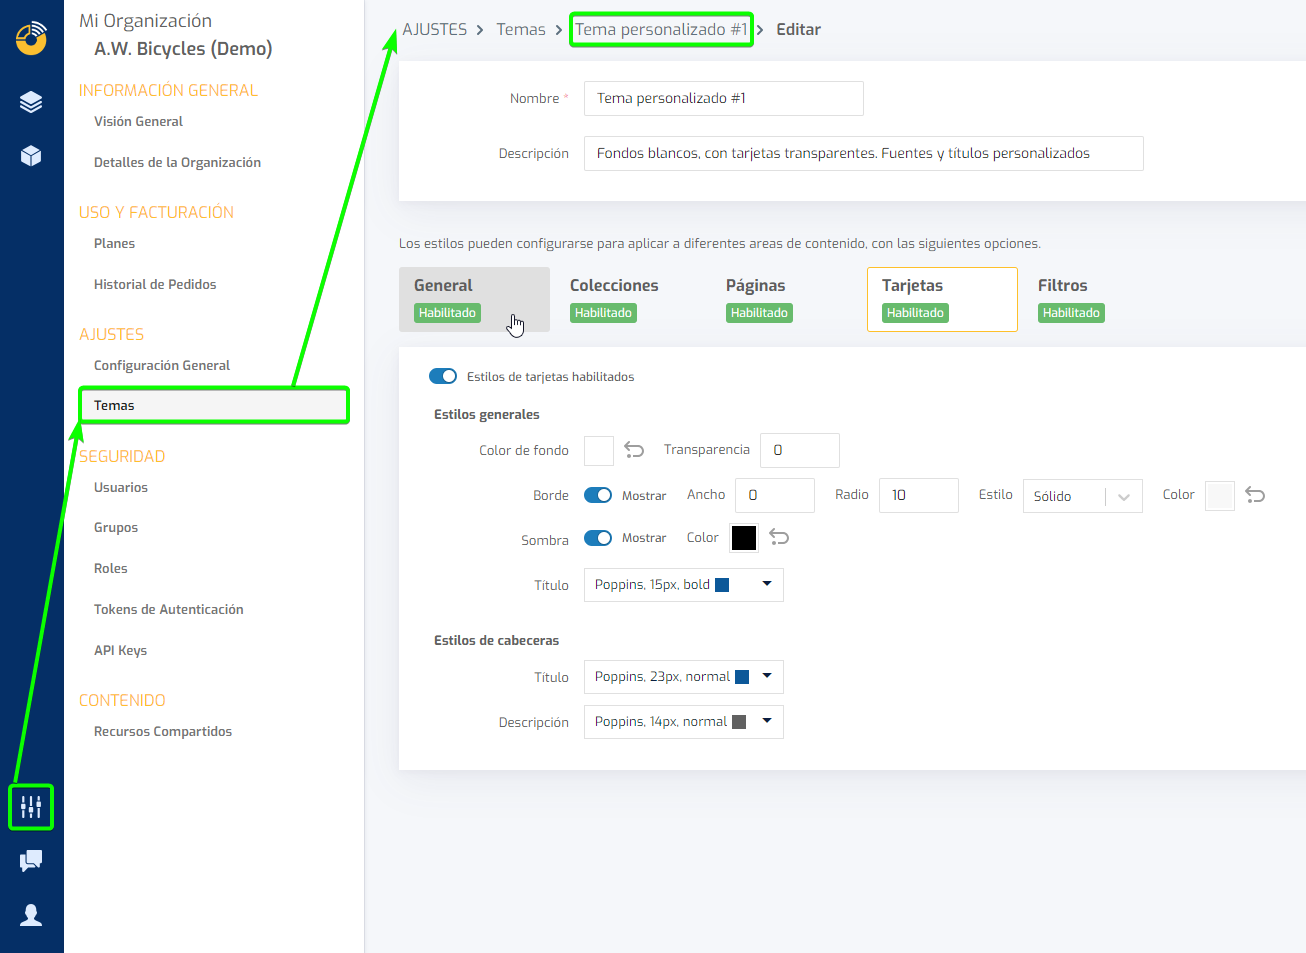
Below we show an example showing a panel with custom styles, where three themes are applied, one at a general level and two to give specific styles to cards with background and border colors, in addition to rounded corners, shadows, etc.
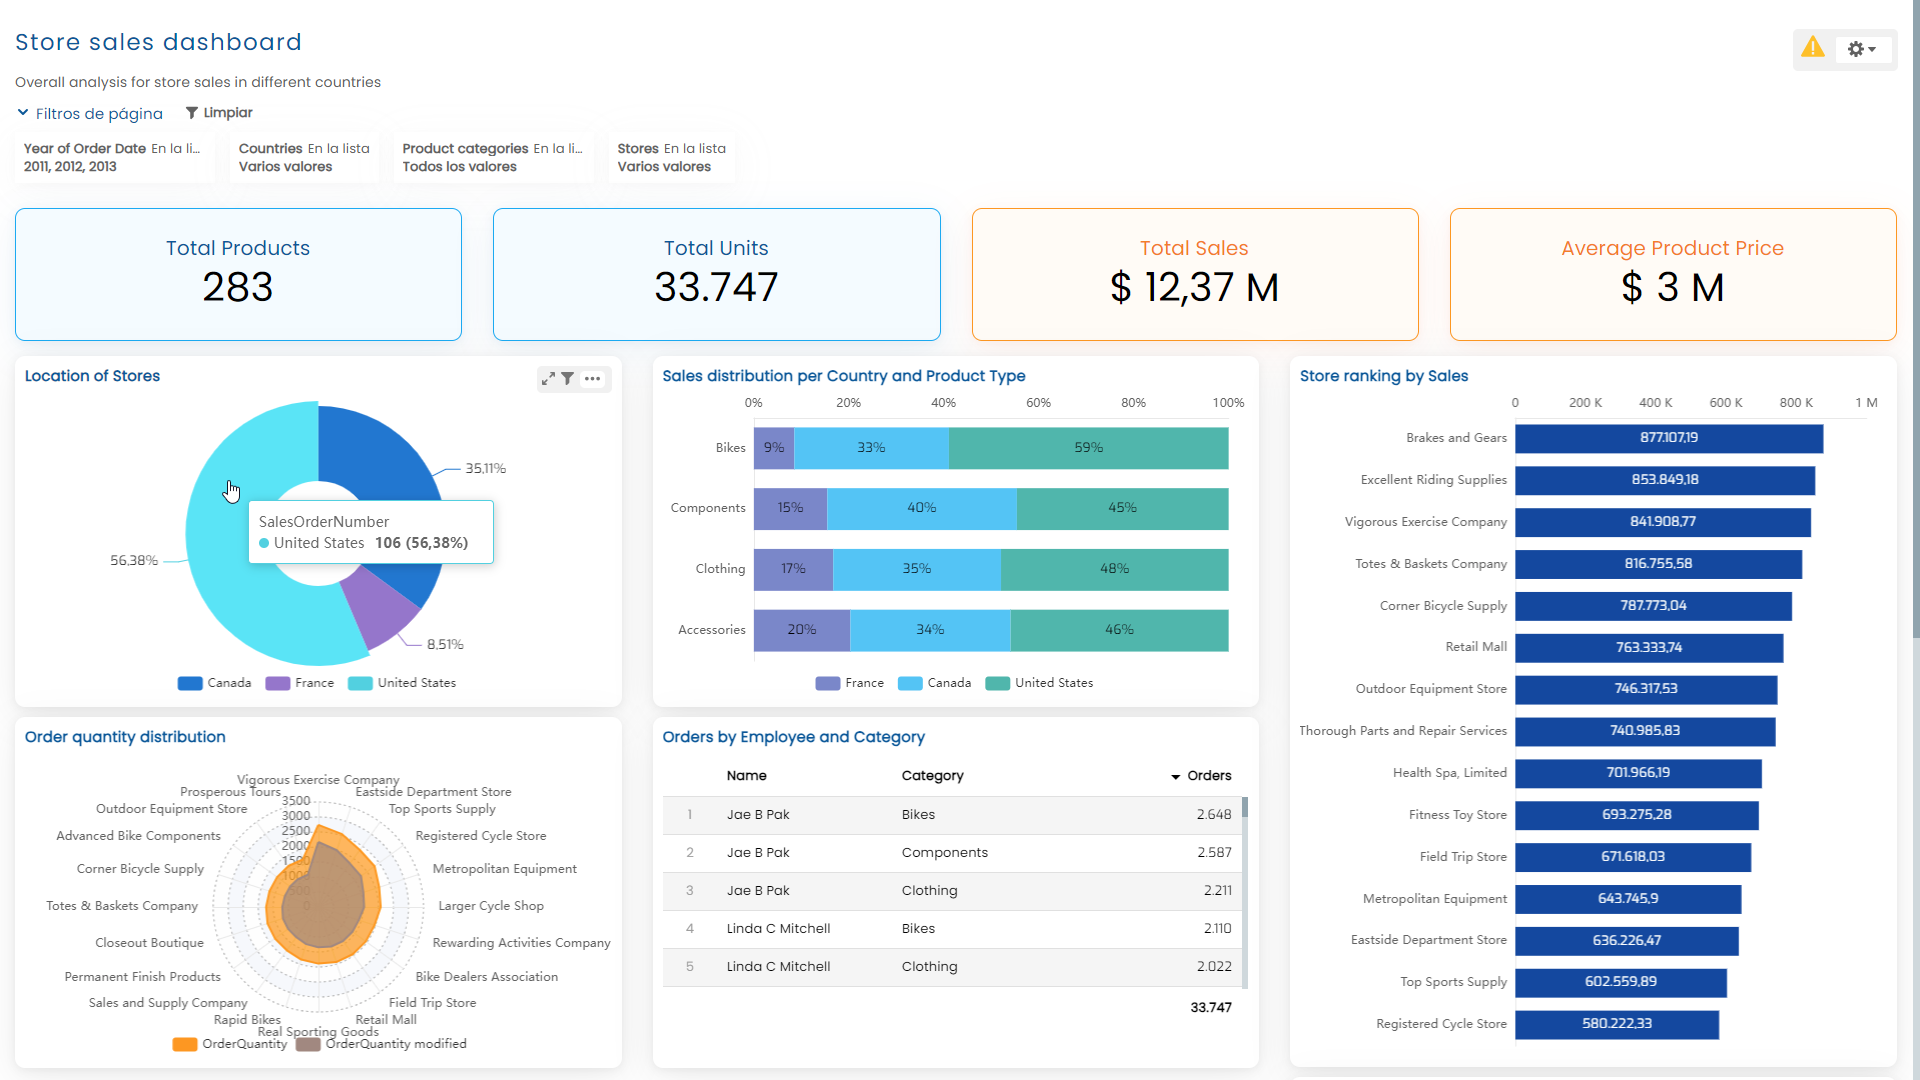
Virtually any detail, such as buttons, watermark colors, and form elements, can be customized in the filter system.
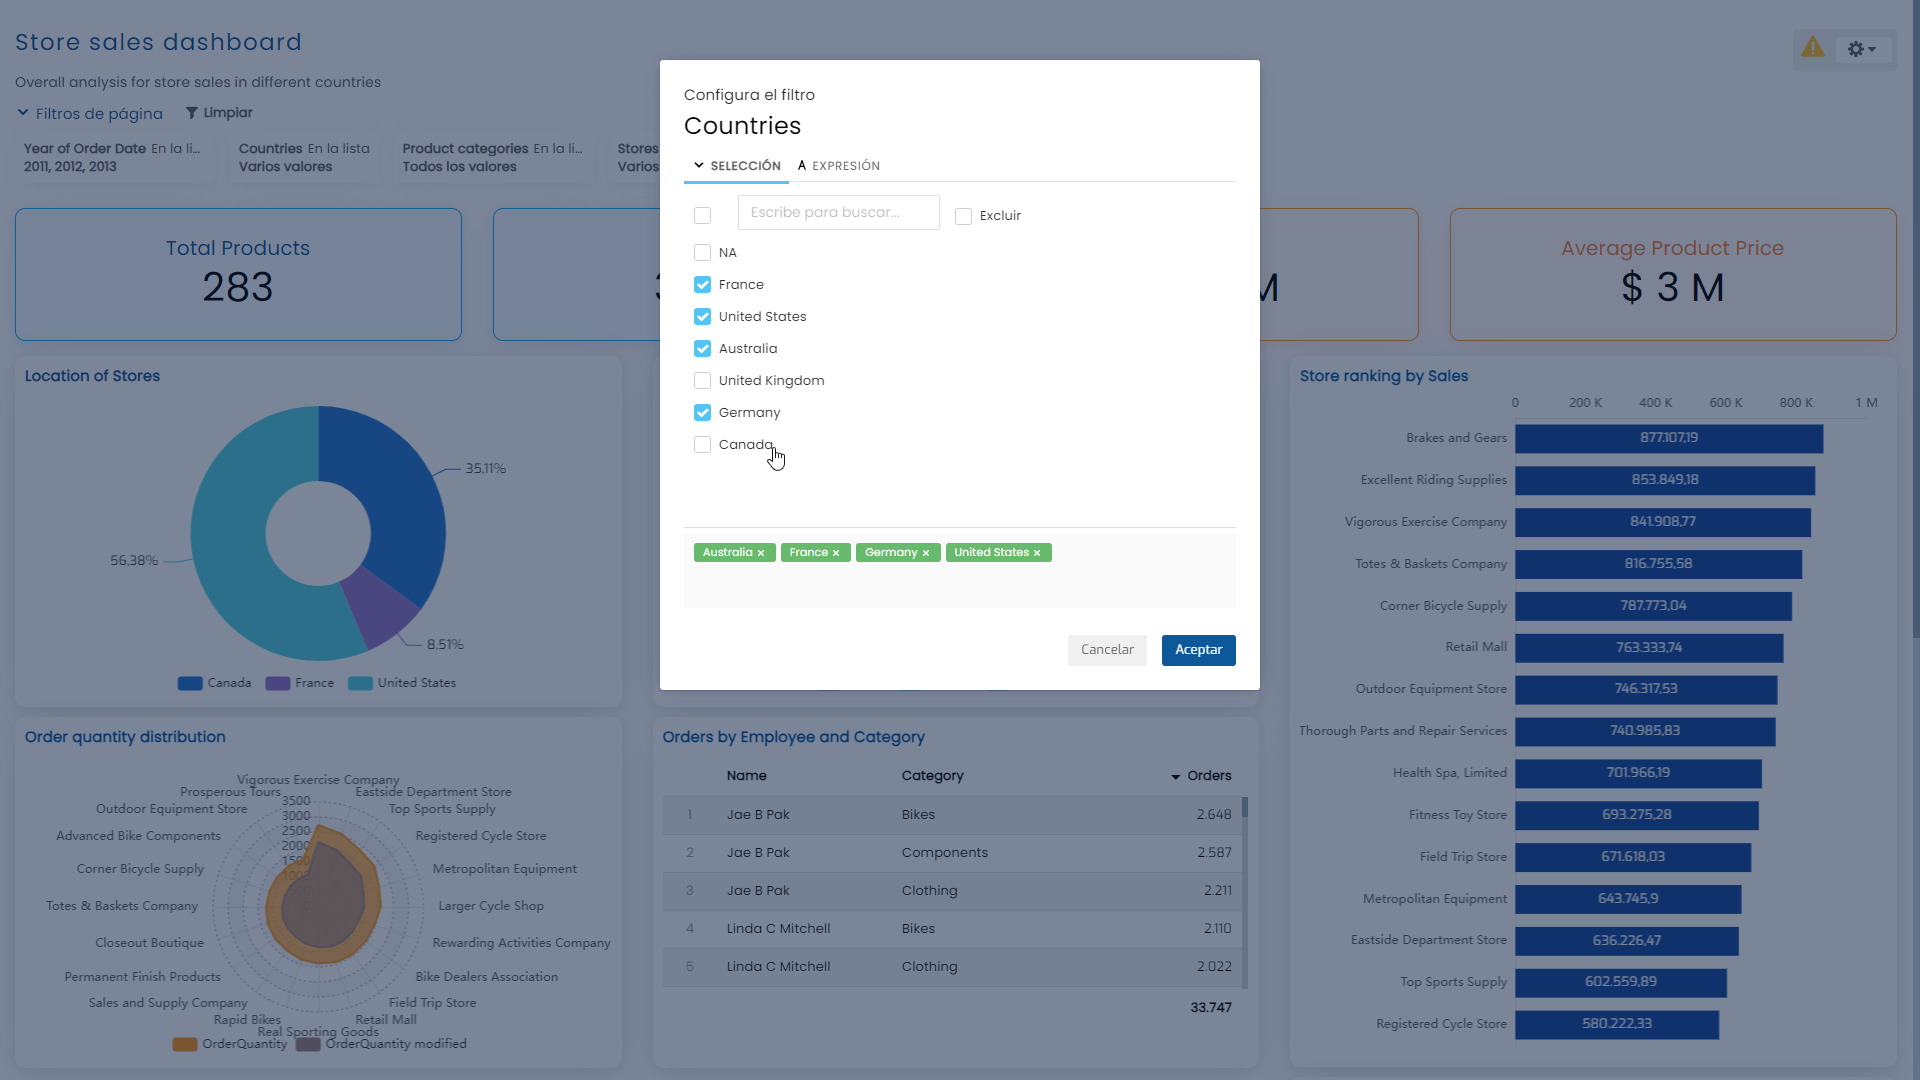
We will soon add a dark theme to Biuwer's predefined themes for integrations in applications with dark colors. How do you plan to use Themes in your Organization?
-
New IFNULL function available for Card Calculated Fields. Usage is simple, as a wrapper to handle nulls or no data returned. The usage is as follows: IFNULL(expression, value if expression is null), for example, IFNULL({Q1.1 Field}, 0)
-
New PREV_PERIOD function available for Card Calculated Fields. The use is like the rest of the PREV_XXX functions (PREV_YEAR, PREV_QUARTER, PREV_MONTH, PREV_WEEK, PREV_DAY), only in this case the level of the applied date filter (YEAR, QUARTER, MONTH, WEEK, DAY) is taken into account to obtain the previous interval dynamically and transparently for the user. The usage is as follows: PREV_PERIOD(metric field, date field), e.g., PREV_PERIOD({Q1.1 Metric field}, {Q1.2 Filter Date field})
-
A new error notification email has been included when processing credit card payments in the Biuwer billing system. This way, if any incident occurs with your credit card, we will inform you what is happening so we can solve it. For example: expired card, insufficient funds or authentication error with your bank.
-
New Billing Contacts section in the Biuwer Administration area, where you can include both Biuwer users and external emails to be notified by email of everything related to subscription billing.
-
Related to the above, an order payment link has been included, without the need to access Biuwer with an administrator user.
Improvements:
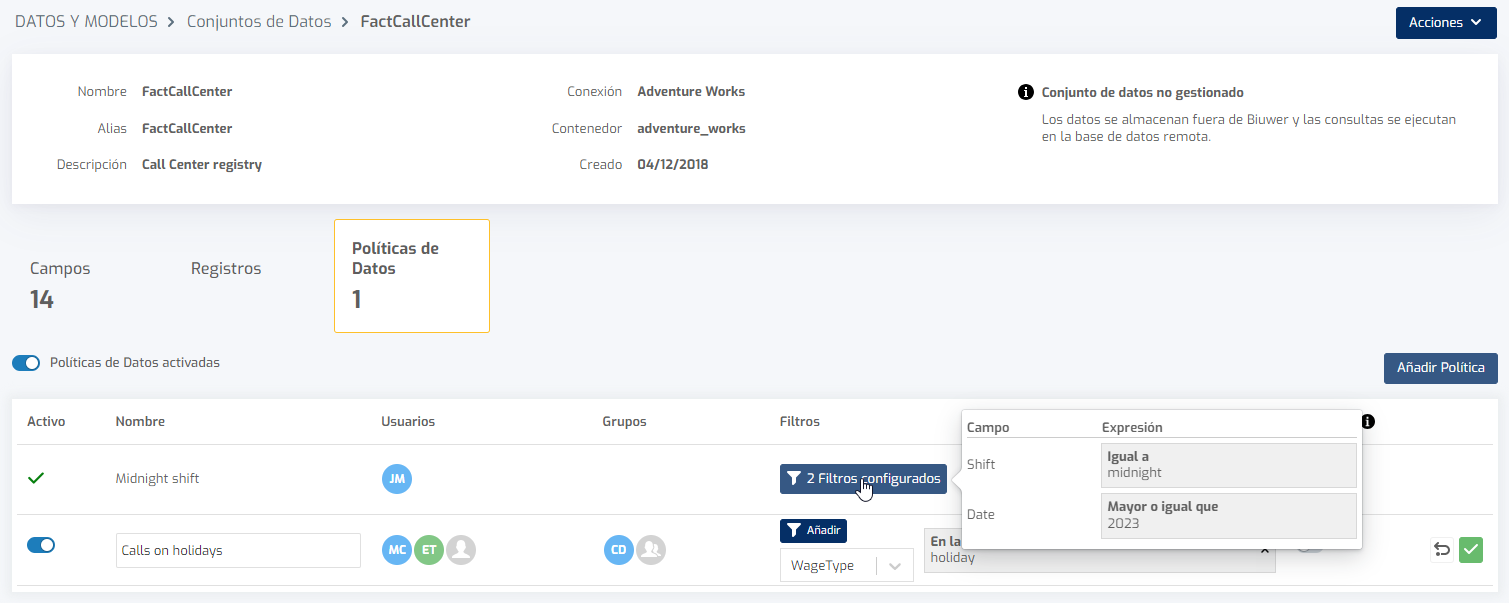
- Data Policies have been greatly improved in this update. It is a key functionality in dynamic data filtering that you need to perform for each user who connects to your data, to only show them the data they need to see. In this update we have redesigned the data policies internally, to support thousands of them for each Data Set, integrated into the Biuwer public API to automate their management. On a visual level, in addition to the new appearance, the Biuwer filter system has been integrated so the power for data administrator users is much greater. In addition to allowing you to activate or deactivate data policies on each Data Set, you can now activate and deactivate each policy individually.
-
SQL query formatting for connections to ClickHouse databases has been included. This way, when you analyze data on this database, you will be able to easily read the queries that are launched from the Biuwer query engine.
-
The API of our payment provider (Stripe) has been updated to the latest available version.
Bug fixes:
-
The YEAR-WEEK format for date filters has been included in the filter mapping of the ACTIONS system.
-
Fixed an issue detected when editing the properties of data models managed by Biuwer.
-
A flickering that occurred in some listings in the Administration and Data Center area has been fixed, depending on the zoom percentage and screen resolution that some users had.
-
Other minor fixes.
October 2023
New functionalities:
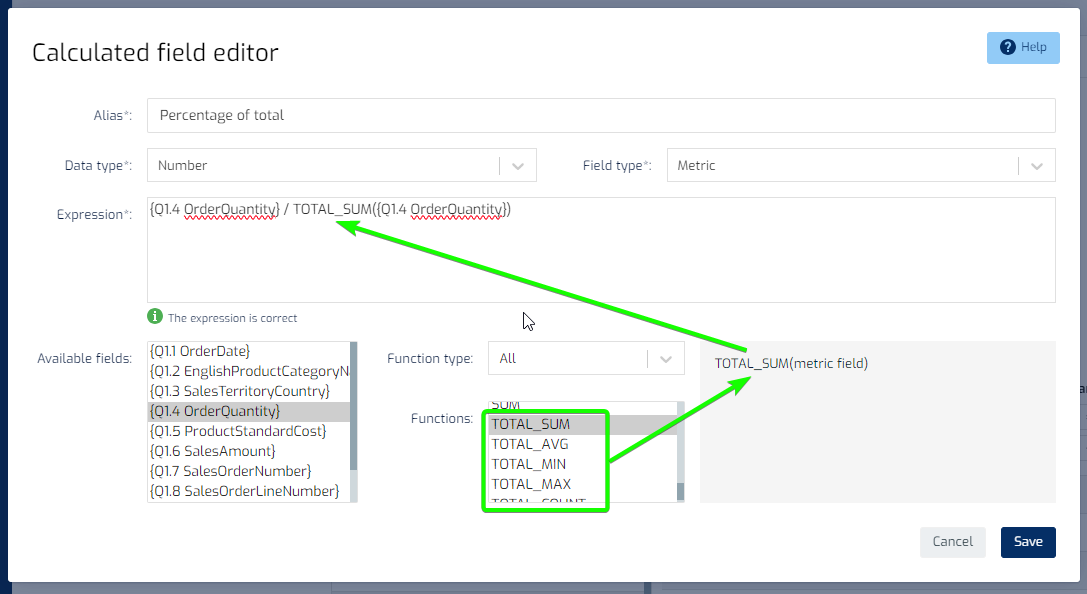
- New functions for total calculations: new functions for calculating totals by applying different operations have been included in the calculated fields of the card editor. Specifically, the functions are TOTAL_SUM (obtains the total sum), TOTAL_AVG (obtains the total average), TOTAL_MIN (obtains minimum of all the field values), TOTAL_MAX (obtains maximum of all the field values), TOTAL_COUNT (obtains the number of total records) , TOTAL_COUNT_DISTINCT (gets the number of distinct records according to the chosen field).
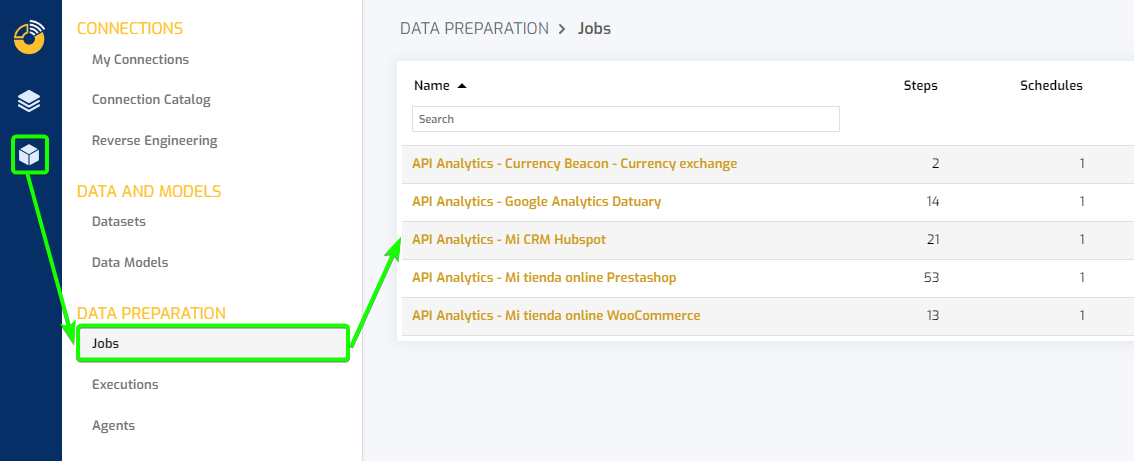
- The names of automatic data jobs associated with API Analytics connections are now synchronized with the respective connection names. Only for organizations that include the Biuwer Data Prep module in their subscription, in the list of jobs, those that are associated with the synchronization of data from API Analytics connections (those on cloud applications, cloud files, REST APIs,...), they have the name synchronized with the name of the corresponding connection. This makes it easier to track updates or be able to execute the specific data job you need at any time, on demand.
Improvements:
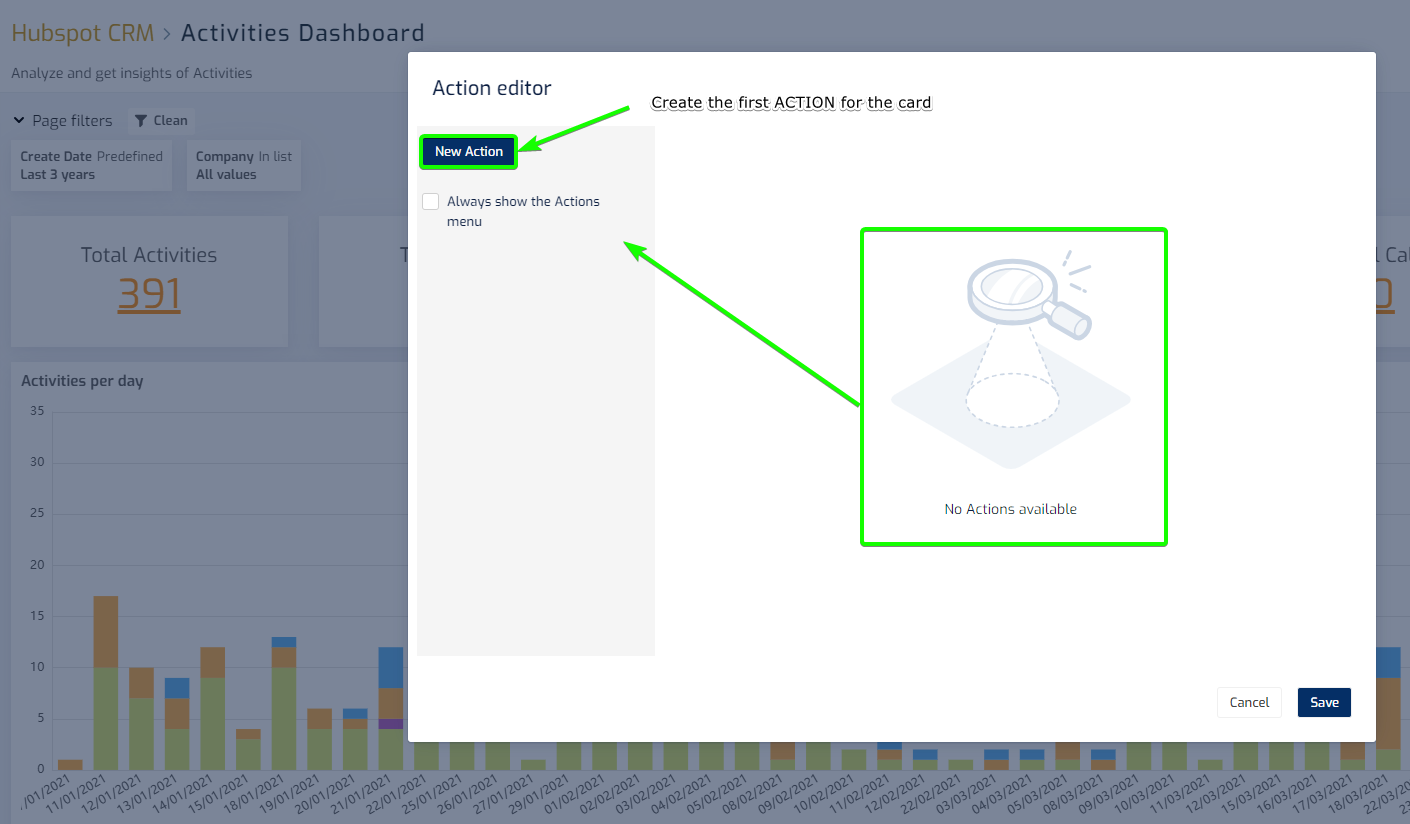
- Messages for empty filter and action lists. This improvement avoids confusion in cases of filter lists or action lists that do not yet have any elements, through an informative image.
- The treatment of actions to external URLs has been improved to allow any expression. The evaluation of the final URL accessed must be checked in each case, since Biuwer does not verify that the resulting URL is correct or works in all cases.
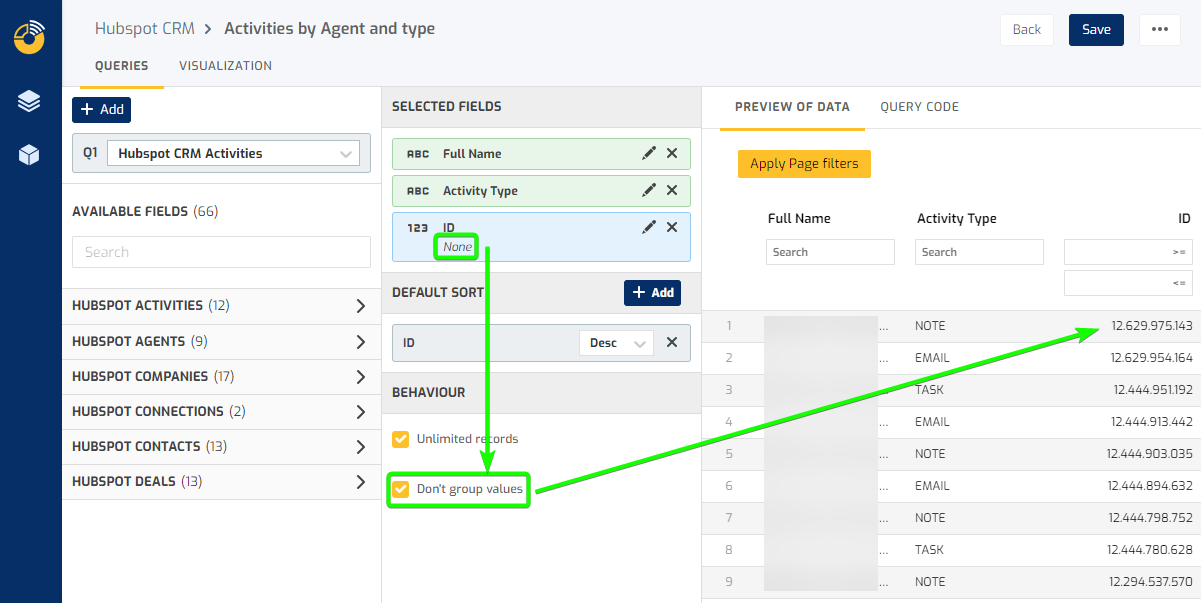
- The “Don’t group values” option has been expanded in the Data Card Editor queries, when in the list of fields all the included metrics have the aggregation “None”. This makes it possible not to group records and allow row-level operations with complete flexibility.
Bug fixes:
- Configured number formats are taken into account when applying conditional formatting on charts.
- The deletion of values in the filter dialog has been corrected when excluded values are being displayed.
- The reported case of an empty order list in the administration area has been solved.
- The logic of accessing Biuwer via email and password has been adjusted, for correct operation in cases of emails whose value is contained in others, for example, martin@mycompany.com and john.martin@mycompany.com
- Other minor fixes.
September 2023
New functionalities:
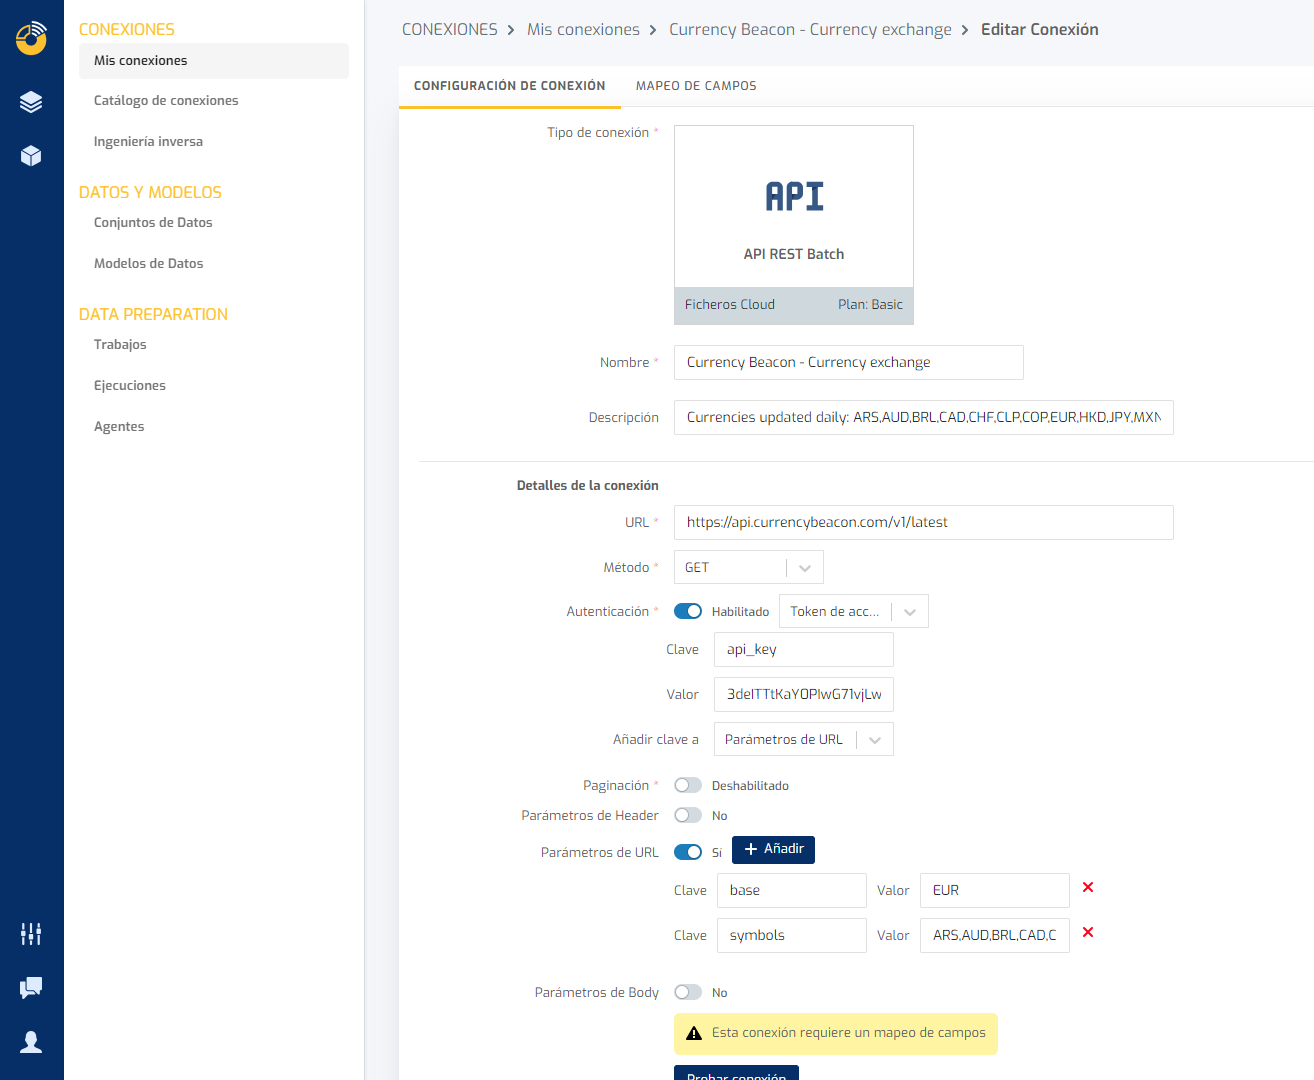
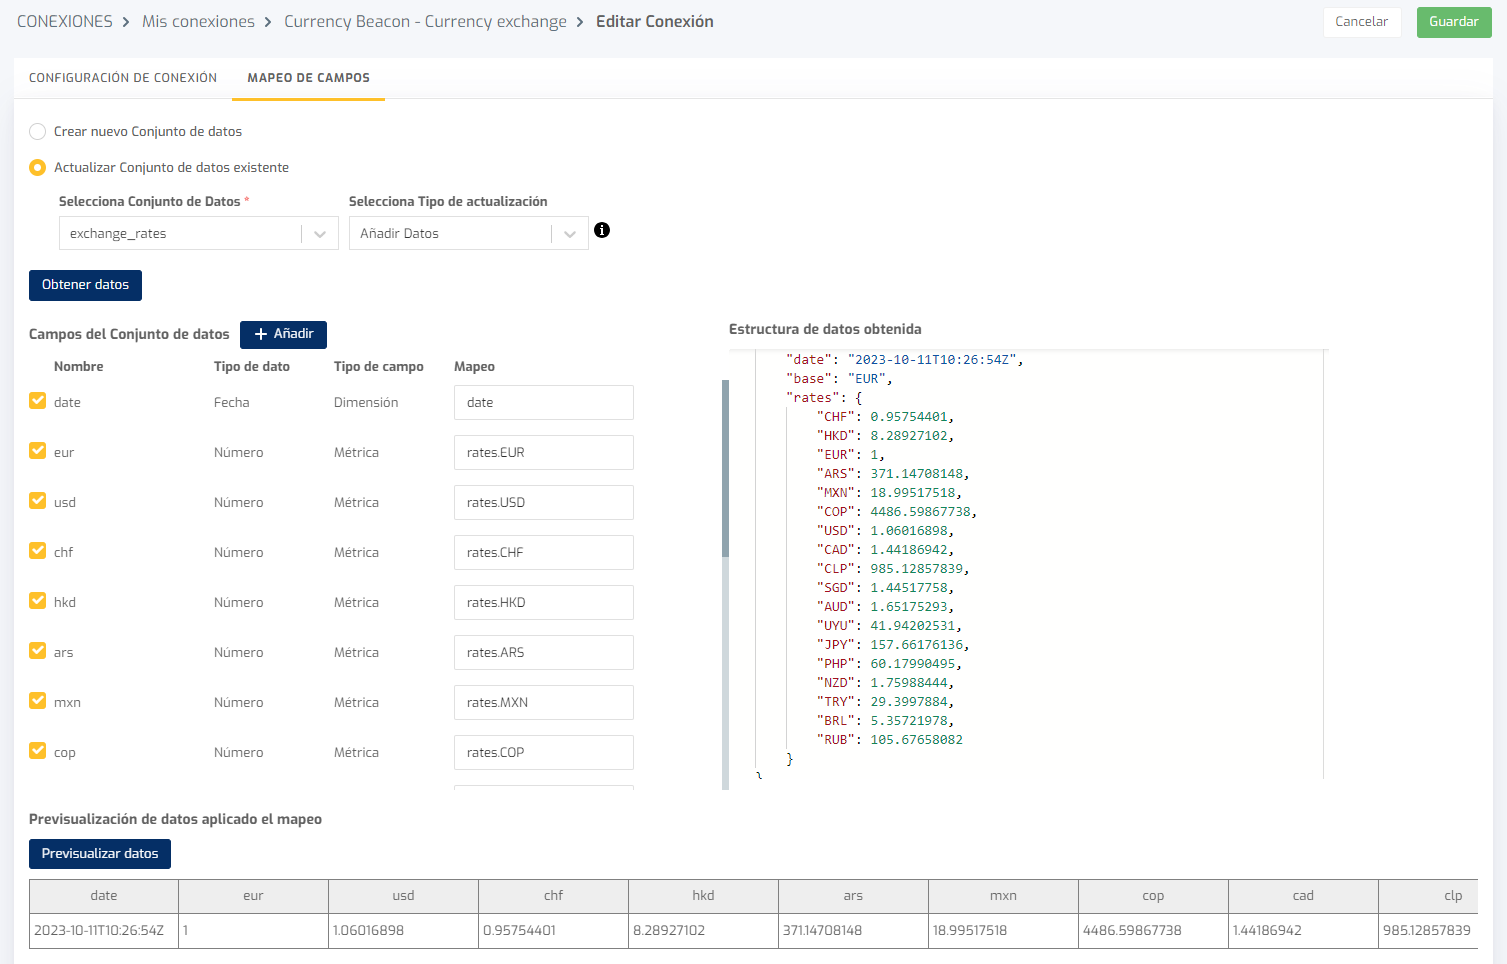
- New REST API data connector in Batch mode. This connector is a real Swiss Army knife! It allows you to access and synchronize your own data available in a URL through an API via HTTP(S), or data from any public API of thousands of online services, with a multitude of options and with the data mapping you need in each case. The possibilities are immense. To give an example, let's say you need to have daily currency exchange rates to include them in your analyzes with other data. Simple… you sign up for a service such as Currency Beacon to use its API. Here we show the connector configuration and field mapping screens. Depending on your plan, you can have data synchronization up to every hour, to add new data or replace existing data.

-
New data management system in Biuwer Data Cards. We have been working for several months on this evolution of the card editor, to allow more use cases with the data you connect in Biuwer, especially to improve the combination of data (Data Blending), allow multiple aggregations, give more power to the fields calculated and many more details. We will soon publish an specific article on the Biuwer blog.
-
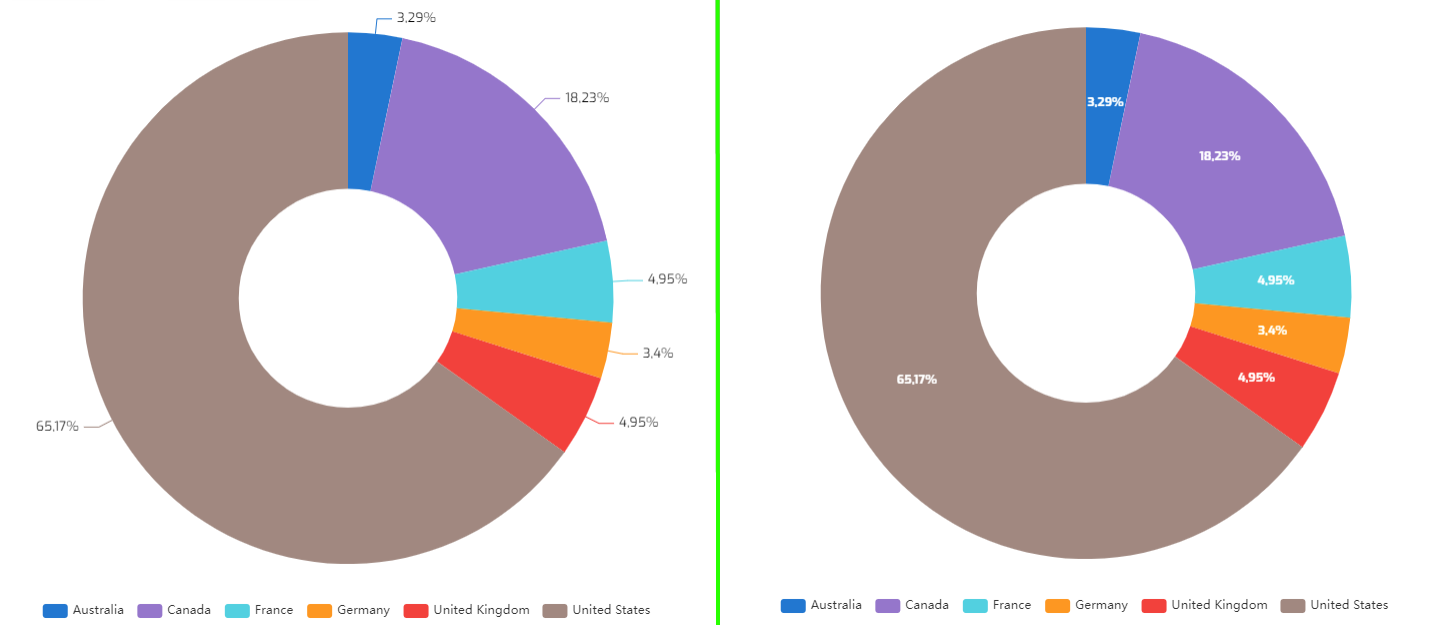
Circular charts now allow you to configure the position of the data labels, outside (default option, only available until now) and inside.
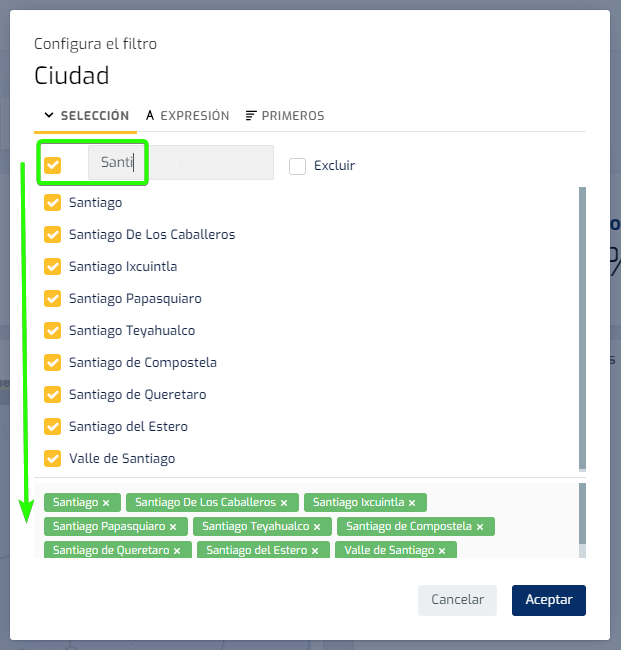
- From now on, users can add option blocks to filters, using the search utility and the multiple selector. This simplifies analysis with large data sets with a multitude of customers, products, or elements from any field. For example, if we want to add all the cities that contain “Santi” at once, we will simply deselect the multiple selector, perform the search and click on the multiple selector again, so that all the options found become in the filter options.
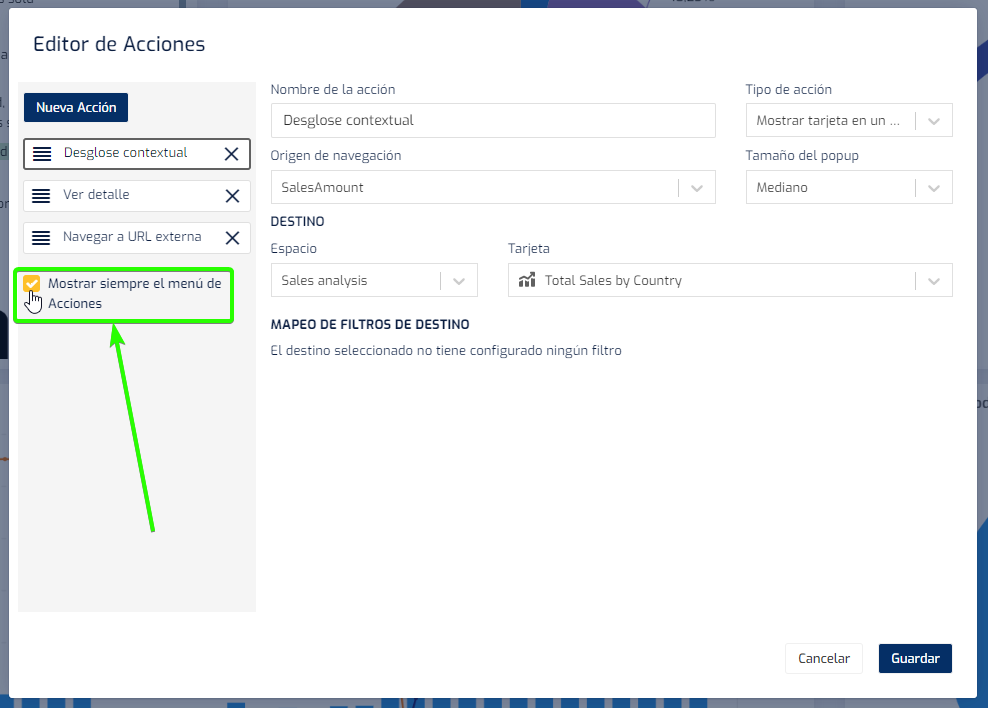
- You can now configure the actions context menu to always appear, even if there is only one action configured. Remember, the default behavior is not to show this context menu if there is only one action, and to show it when there are two or more actions.
Improvements:
- Improvement in subscription configuration, automatic renewals, and functionality control in all current Biuwer plans.
- Visual improvement of charts selection icon area.
- Simplified options for embedding Biuwer content using IFRAME in other applications.
- Visual improvement in vertical table cards, when displaying fetched and displayed rows, and vertical alignment of values.
- Improved help buttons displayed in dialogs.
Bug fixes:
- Fixed a case that caused the Tree Map chart to not display with color applied.
- The lines associated with the axes on chart cards (grid lines) are now displayed in all cases below the rest of the chart elements.
- Fixed issue reported when applying conditional styling on bar charts, which changed metric values incorrectly.
- Other minor fixes.
July 2023
New functionalities:
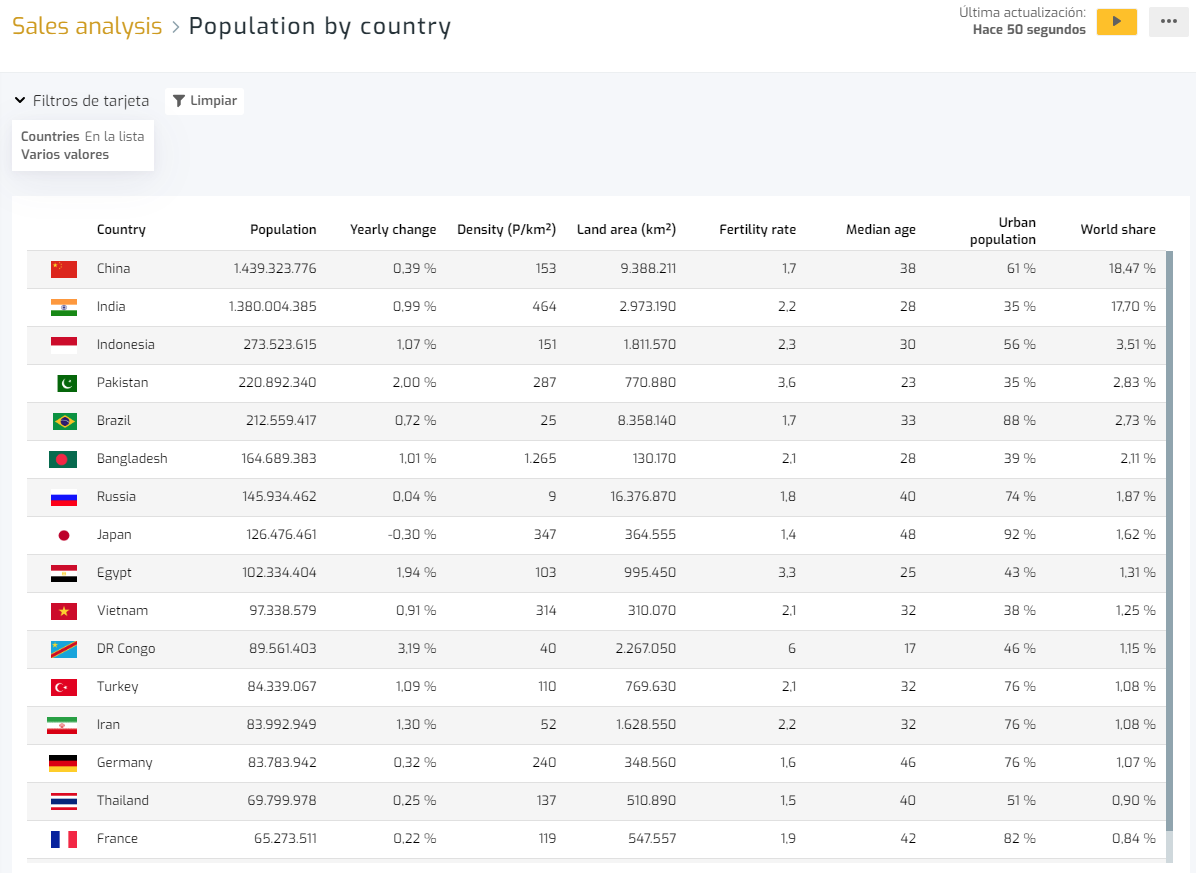
- New image or thumbnail column on table cards. You can now configure fields to display images, icons or thumbnails, in Biuwer vertical and cross tables. This functionality is very easy to configure using calculated fields from a base URL modified with a country code, a product code or any other identifying parameter.
- New styles of card titles. The importance of design and image is increasingly relevant to offer users more careful visualizations. We start the customizable styles to come, with new more minimalist styles for card titles. Soon more visual customizations can be applied to Biuwer Cards.
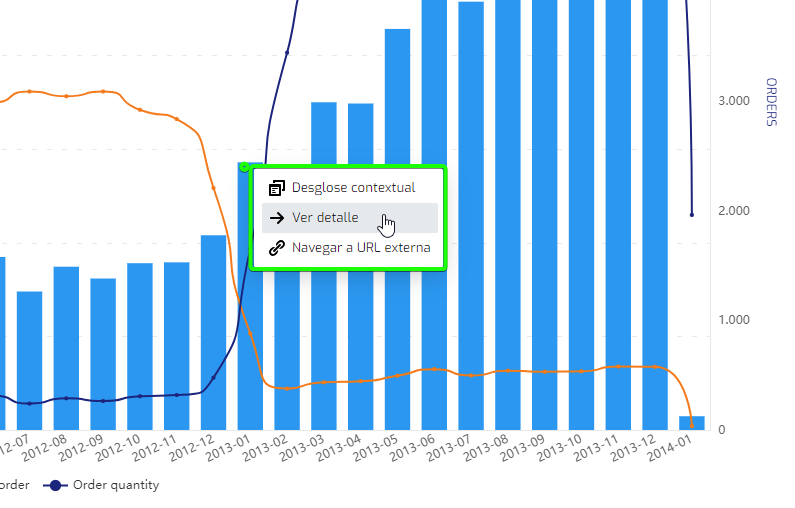
- New context menu for multiple actions. When several actions are defined on the same interactive element, the user is shown a context menu with the name of the action to select between them.
- New basic user pack addons. To get the data visualizations to all your users, in addition to the basic users included in your plan, you can now configure with greater control between a set of basic user packages, with packs of 25, 50, 100, 250 and 500 units.
- Filter values with URL parameters can now be applied in the actions system. This use case is quite powerful as it allows automatic filter configuration via URL parameters and these values are taken into account in the available Biuwer actions.
- In Data Card Editor queries, the same field can be added more than once. This functionality allows, for example, to obtain the sum (SUM) of a field and the average value (AVG) of the same field, in the same query.
Improvements:
- Payment flows by credit or debit card have been improved, with automatic notification emails.
- Content lists have been improved through virtualization to increase usability and speed, for thousands of simultaneous items.
- The types of data coming from JSON structures have been better controlled in the visual elements, since depending on the cases, data could be displayed incorrectly.
- The export of data to CSV / Excel files has been improved again.
- The Biuwer Share application (the one used to embed content in third-party applications) has been optimized for improved load times, reduced use of resources and fewer data exchanged.
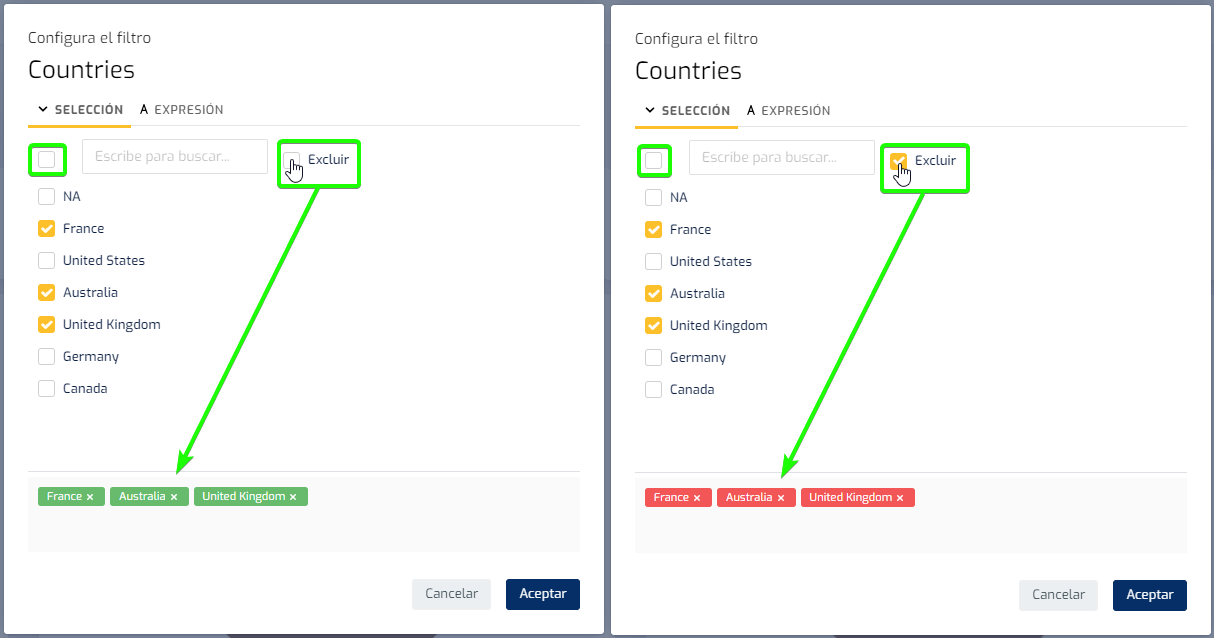
- Filters usability has been improved, to allow to include and exclude values more easily. The check shown before the search box allows you to include all or none of the elements as before, but the ability to include or exclude values depends on the “Exclude” check after the search box.
Bug fixes:
- Card Actions configured in the corresponding dialog are correctly applied in all cases when configured from a Page.
- After some incorrect results have been reported when launching data queries including special characters such as ? or ' these have been included in the Biuwer query engine so that they are taken into account.
- Fixed some vertical scrolls on Cross Table Cards.
- Fixed data export to Excel when a field title has been set to empty by the user.
- An error in the percentage calculation shown on the Tooltip has been corrected in Speedometer charts.
- Fixed a reported bug when applying conditional styles on charts.
- The default values in "Date and Time" filters now include the last day of the interval selected by the user.
- Other minor fixes.
June 2023
New functionalities:
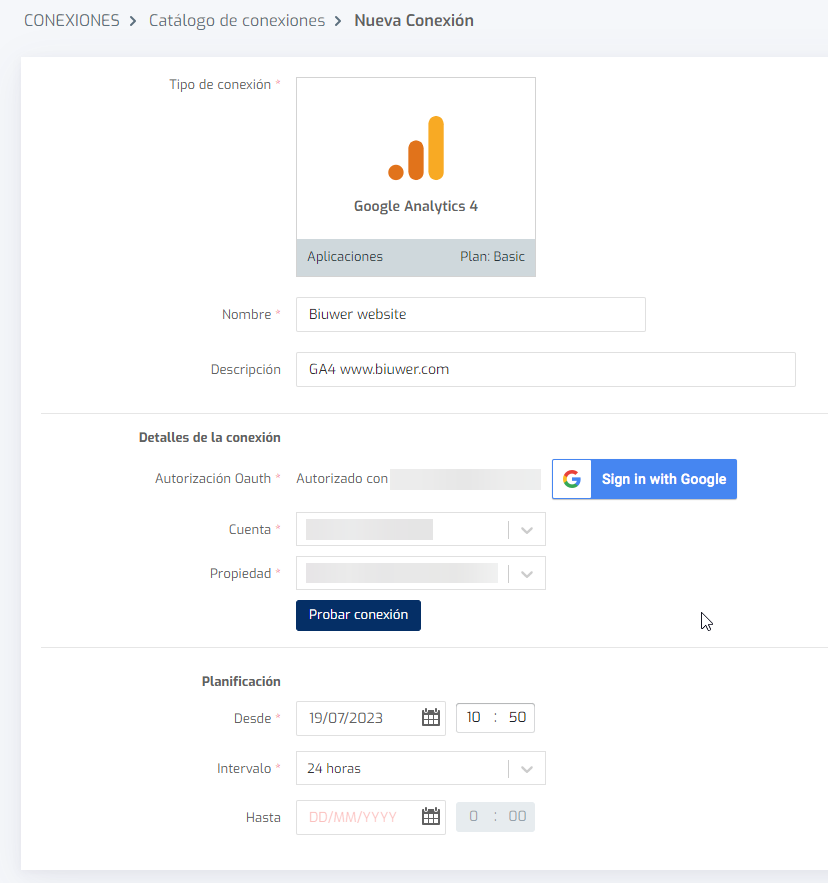
- New Google Analytics 4 (GA4) data connector. As you know, since July 1, 2023, Google has stopped processing data from Google Analytics 3 (Universal Analytics) accounts. With the new Google Analytics 4 connector, you can now connect your Google Analytics accounts to Biuwer, so that the data is automatically synchronized and you can analyze it however you want, alone or in combination with other data sources. The connection configuration is just as simple as usual in Biuwer, as you can see in this screenshot.
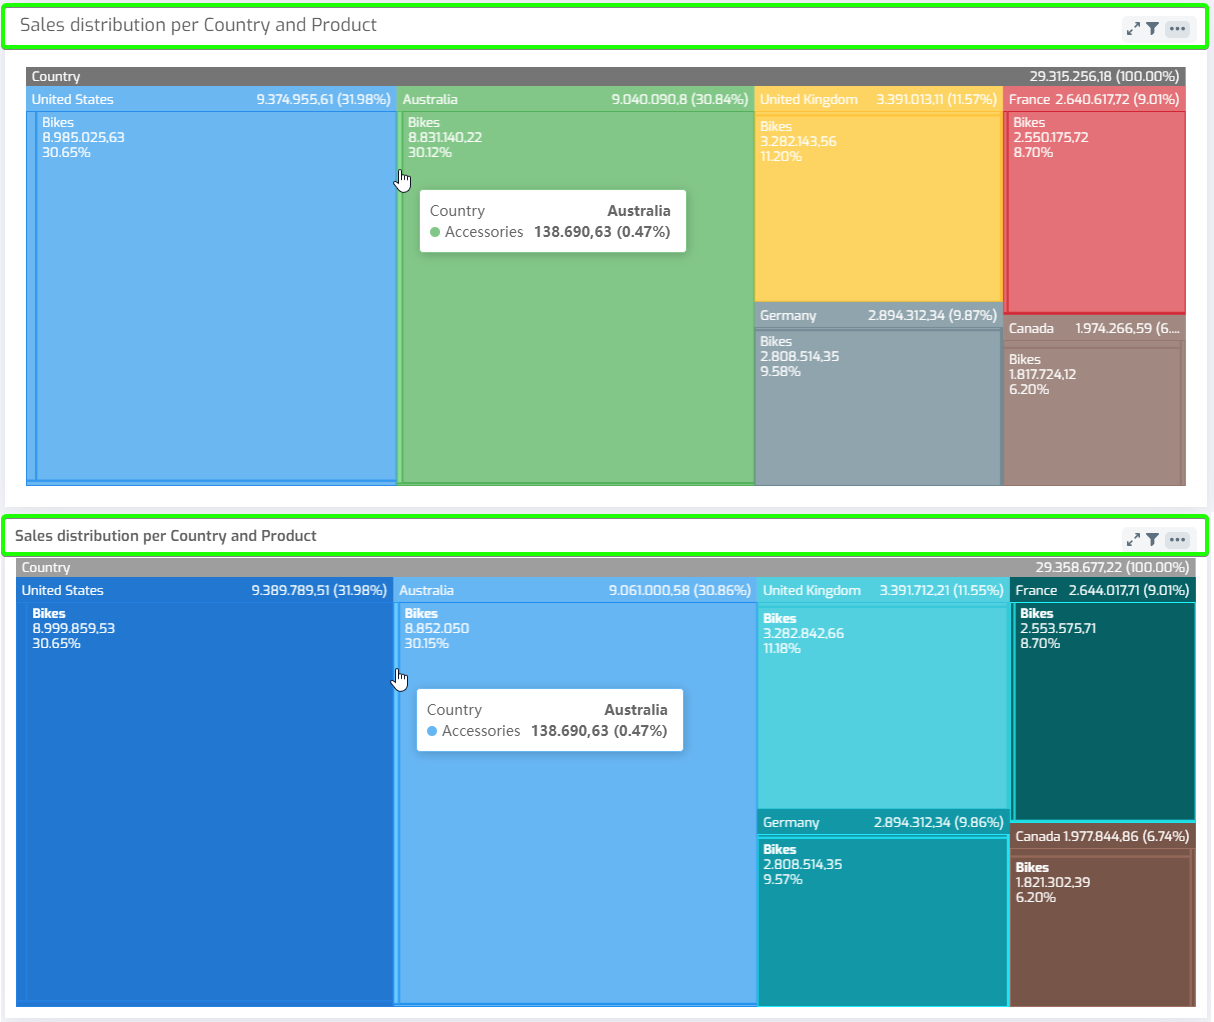
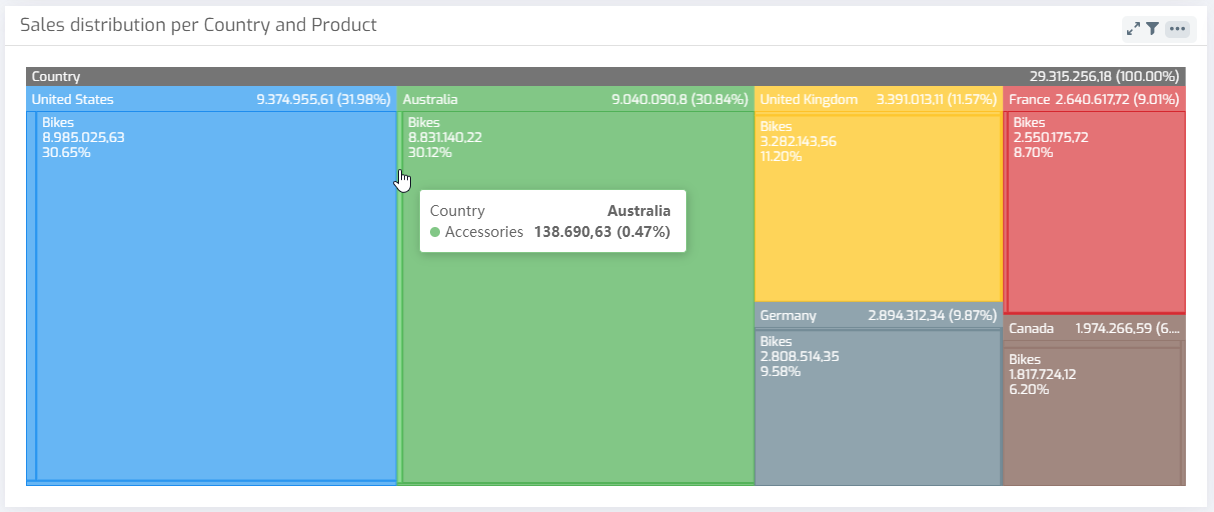
- New Treemap chart type. This is a very useful chart to visualize how the values of a metric are distributed in an area, with one or two dimensions. For example, the breakdown of the amount of sales by country and product category, as shown below:
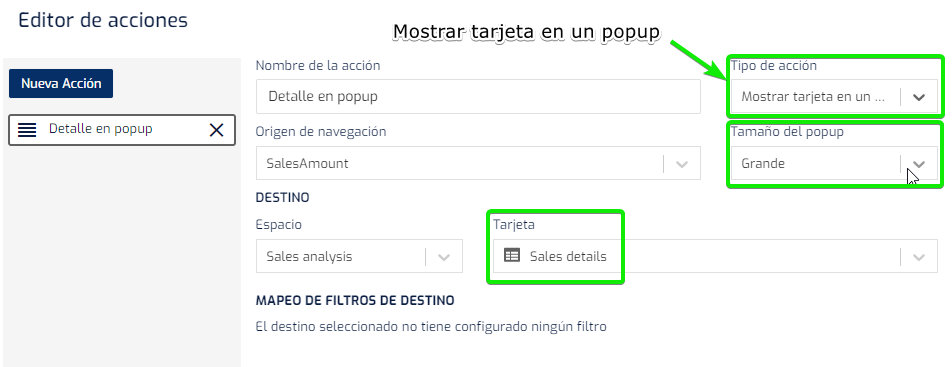
- New action to show a card in popup. This action allows any card to show another in a popup or overlay. This new type of actions allows you to implement things like seeing a detail from a KPI, a chart, a table with aggregation, etc. From the "Actions" menu of the card:
- The action system is now available on Chart Cards. Since this version, charts include navigation to other pages, cards, external URLs, and popups, like other cards. Soon a contextual menu will be enabled to show the user the configured actions to choose which one to launch.
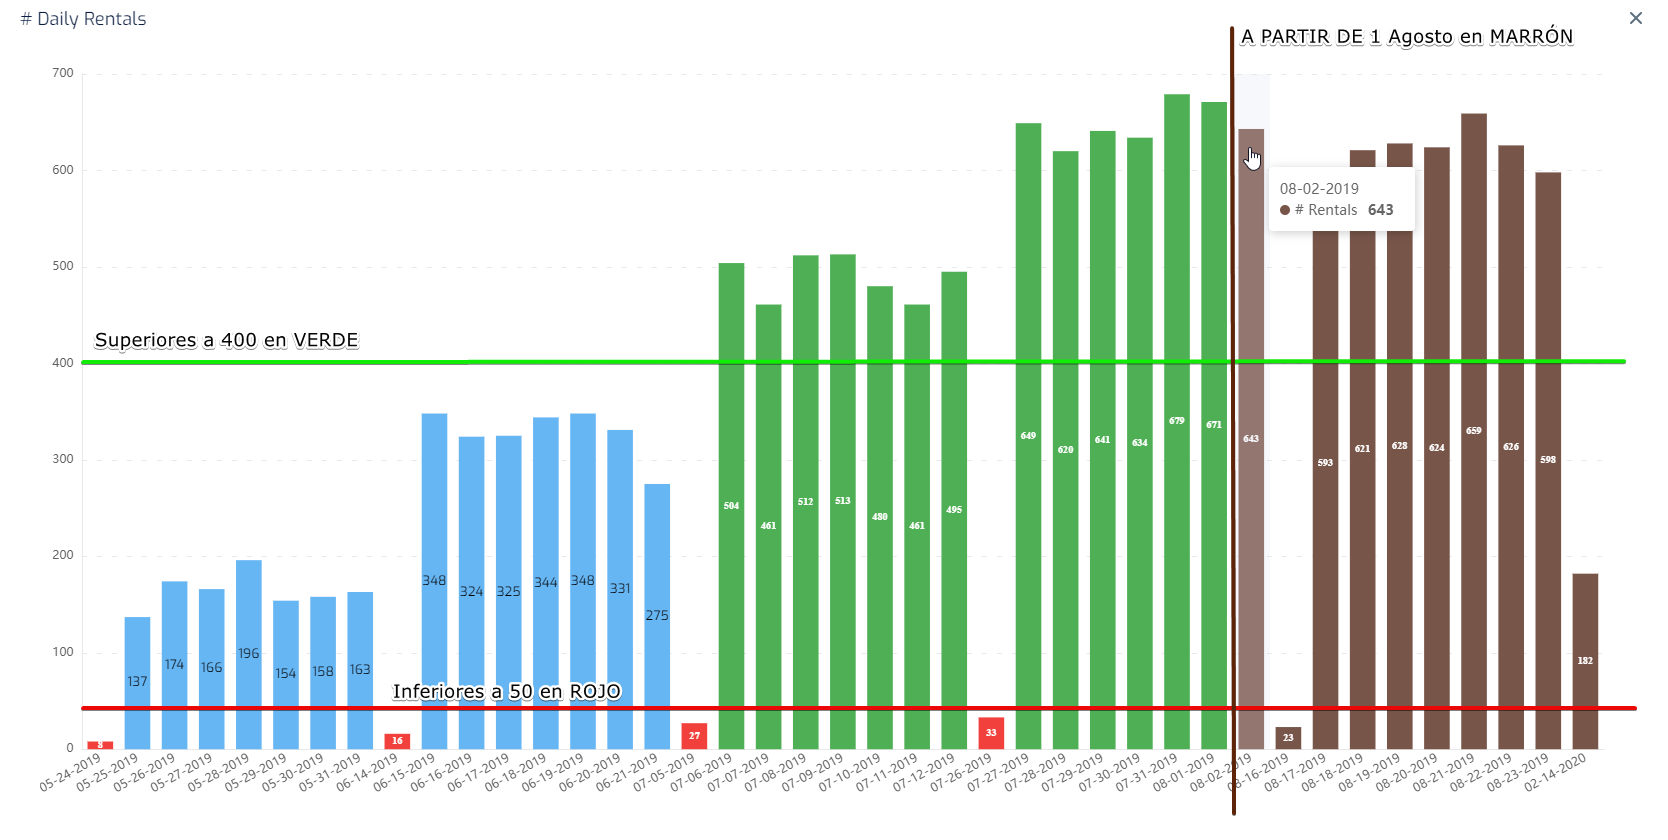
- Conditional styles are now available in Chart Cards. Since this update, charts include conditional styles based on chart type. The possibilities are quite powerful. Below is an example, where blue is the original color of the series, and conditionally, it shows: in green the values greater than 400, in red the values less than 50 and in brown the values for dates greater than 1 of August.
Improvements:
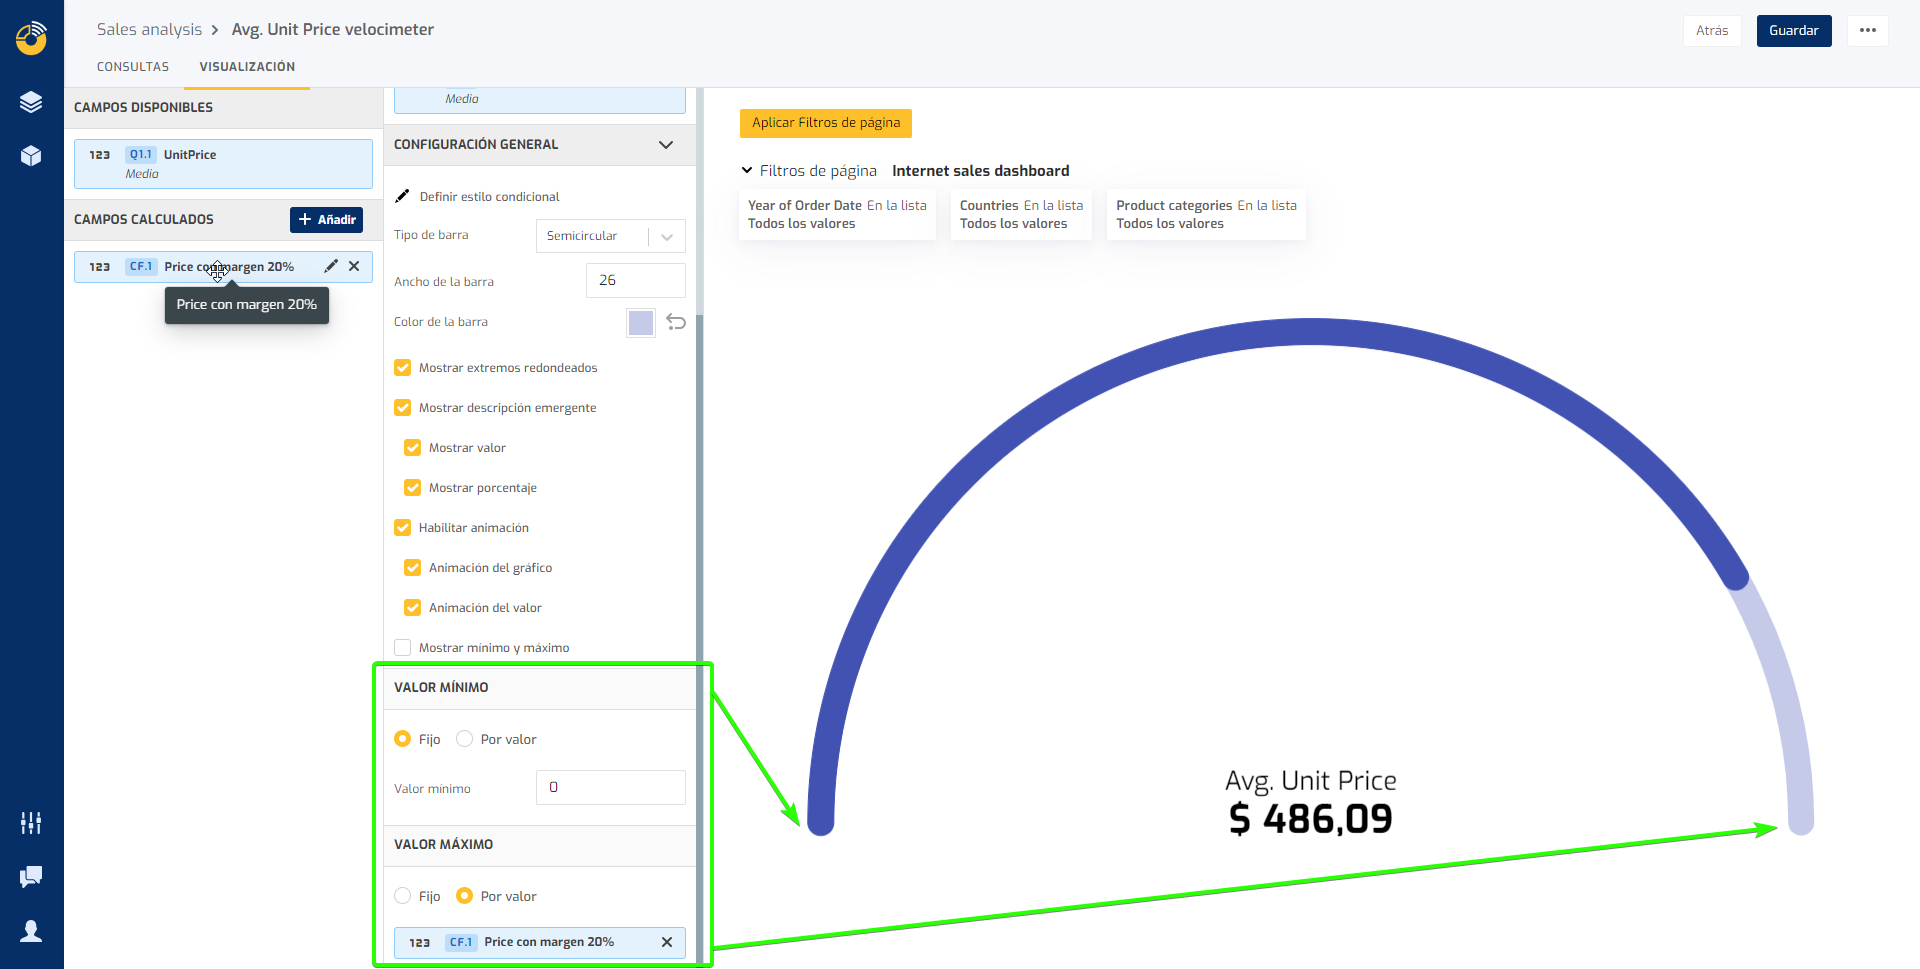
- You can now use a data field to specify the minimum and maximum values in Speedometer Charts. It is useful for cases in which you want to dynamically compare the value of a metric against a target, defined in another data field or in a calculated field.
- We've improved the Data Sets list so you can filter them better, access context menus more easily, and we've removed unhelpful information.
- We have improved the Page creation flow, to specify the title initially. This prevents multiple pages from being created "by mistake".
- We have added a help button in the Card Calculated Fields creation and editing dialog, within the Data Cards Editor. With this button you can quickly access the Biuwer help page, to consult the available functions and how to use them, with examples.
- We've slightly expanded the custom value sort dialog in the Data Card Editor. In this way, the values with the most available space are displayed when sorting them by the criteria you need on the screen.
Bug fixes:
- Fixed cases where data labels were displayed below bars on stacked bar chart cards.
- Date filter operations have been adjusted for the Clickhouse connector.
- When switching a chart card between different types, those chart types that do not have a legend available are taken into account and not displayed.
- The number formats configured in the Organization or User are applied in various chart types.
- Other minor fixes.
May 2023
New functionalities:
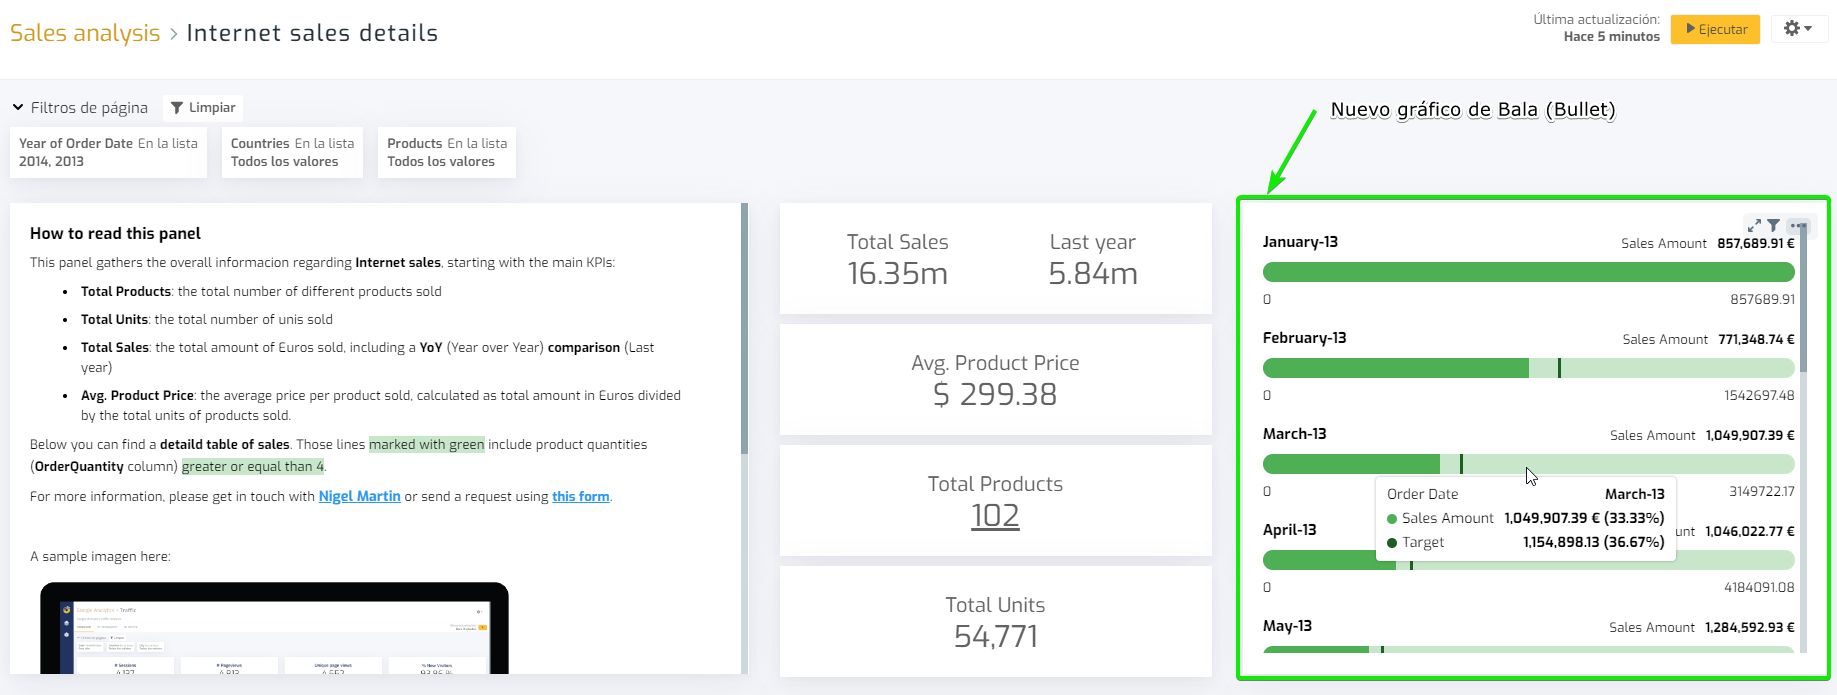
- New type of Bullets chart. With this new type of chart, the value of a metric between an initial and a final value can be visualized in a very easy and intuitive way for the end user. A very common use case is to build progress bars, with different formats, colors and configurations. You can also include a metric as a target value to check progress or compliance. If you include a dimension field in the chart editor, there will be displayed as many bars as there are elements in the dimension! The start and end values can be dynamic if you use data fields.
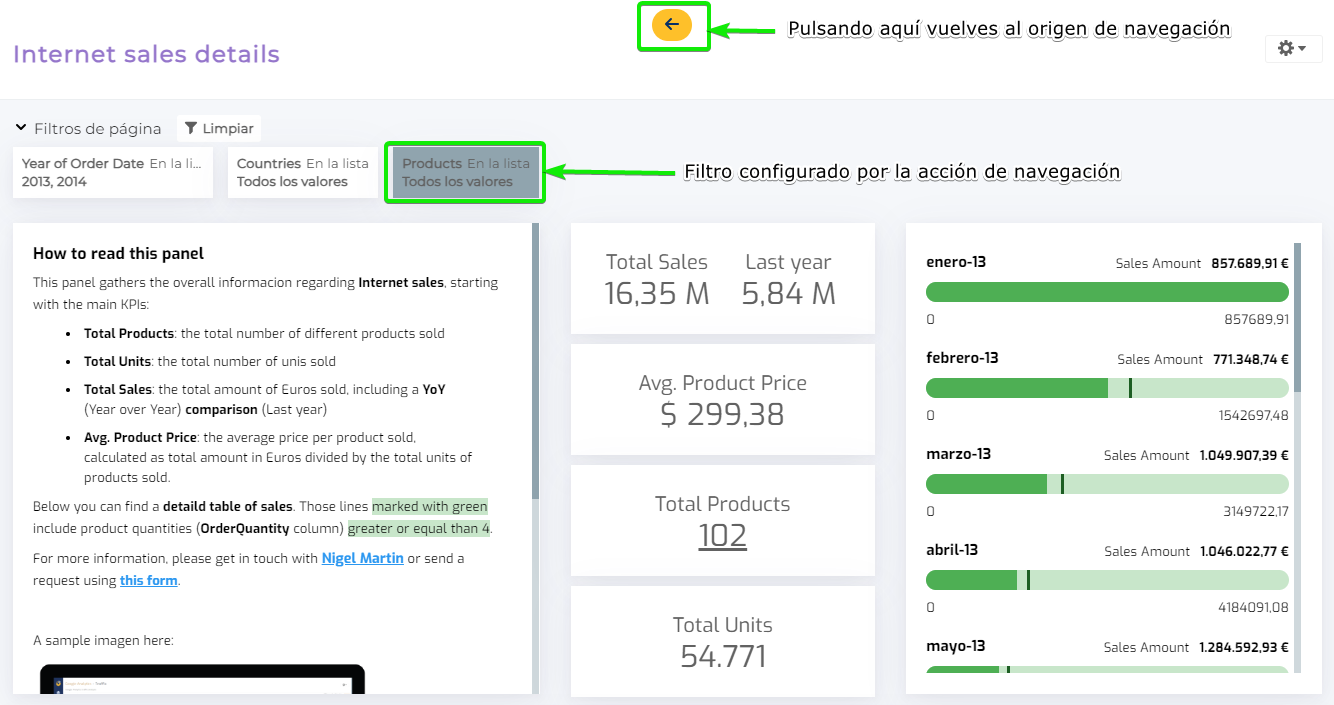
- Navigation actions available in Embedded Analytics. When you embed Biuwer in external applications or share it externally, you can already use the configured actions. This allows you to implement multi-step analysis flows. Use the new floating utility area at the top to navigate backwards. Configure in detail how you want the filters to propagate between different contents (pages or cards).
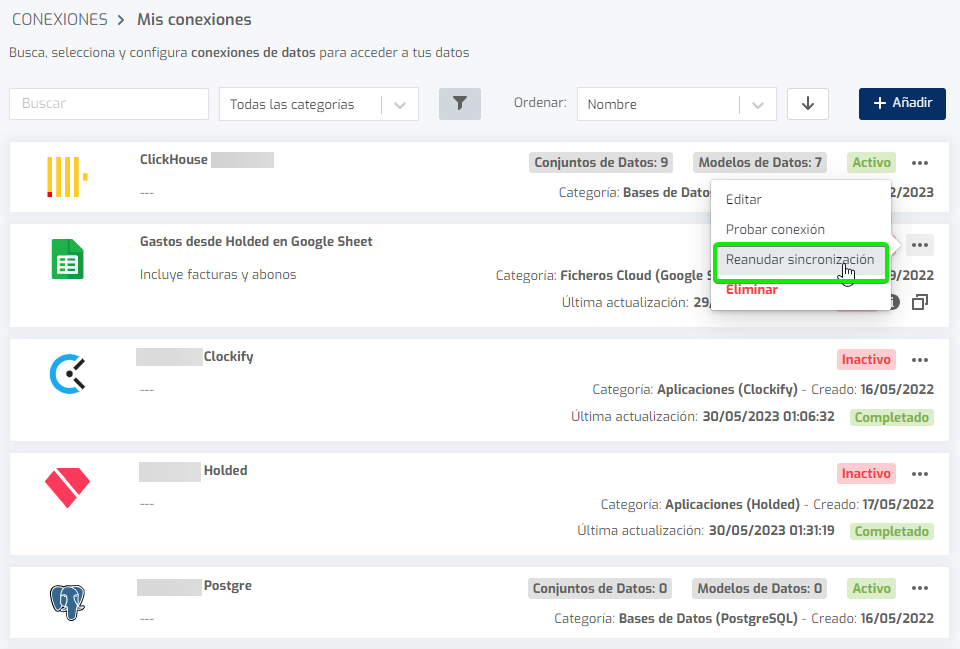
- New mechanism to pause and resume automatic data synchronizations for Application type connections, e.g. cloud APIs that you have connected to Biuwer.
Improvements:
- We have improved the export of numerical data to Excel and CSV files, so that regardless of the visual formatting you have applied in Biuwer, they are always exported as numbers directly usable in Excel or other applications. This means that if you set up percentages, currencies, thousands separators... Biuwer will remove them when exporting these fields.
- Clearer messages have been included to explain the inheritance of permissions that are set up in Biuwer in Shared Spaces.
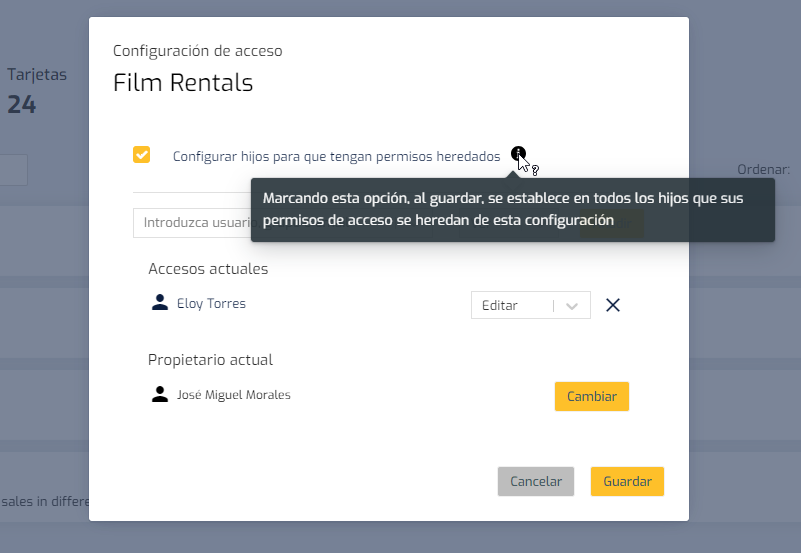
- The navigation system has been improved to correctly apply in destination dependent filters in all cases. This means that when navigating between contents, a filter can be mapped to a destination on which others depend and these will have the correct values.
- In the configuration of Data Policies of Data Sets, from now on the filter itself configured for the user who is doing it is not applied.
Bug fixes:
- Fixed a bug in BETWEEN filter expressions at DAY level for MONGODB when TIMEZONE is applied in the connection.
- The closing of connections has been included in the Reverse Engineering processes, when obtaining Datasets from Database type connections.
- Other minor fixes.
April 2023
New functionalities:
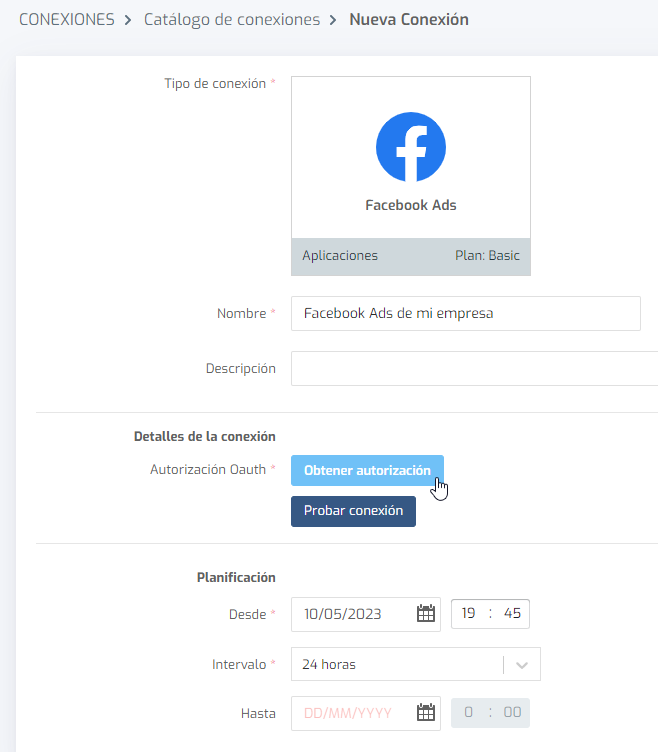
- New Facebook Ads data connector. By connecting your Facebook Ads accounts in Biuwer, you have all the data you need to improve the performance of your ad campaigns on the Meta network, such as clicks, CPC (cost per click), cost per ad and campaign, conversion rate, conversions obtained, cost per conversion ratio, etc.
- New Pipedrive data connector. Pipedrive is one of the most popular CRMs (Customer Relationship Management) on the market and since this update you can analyze all the data you generate in your Pipedrive account in Biuwer. It includes an automatic data update with several time intervals available to choose from, in order to visualize in detail the most important entities available in the public Pipedrive API such as: Activities, Deals, Pipelines, Stages, Leads, Users, Persons, Organizations, Currencies, Products or Notes.
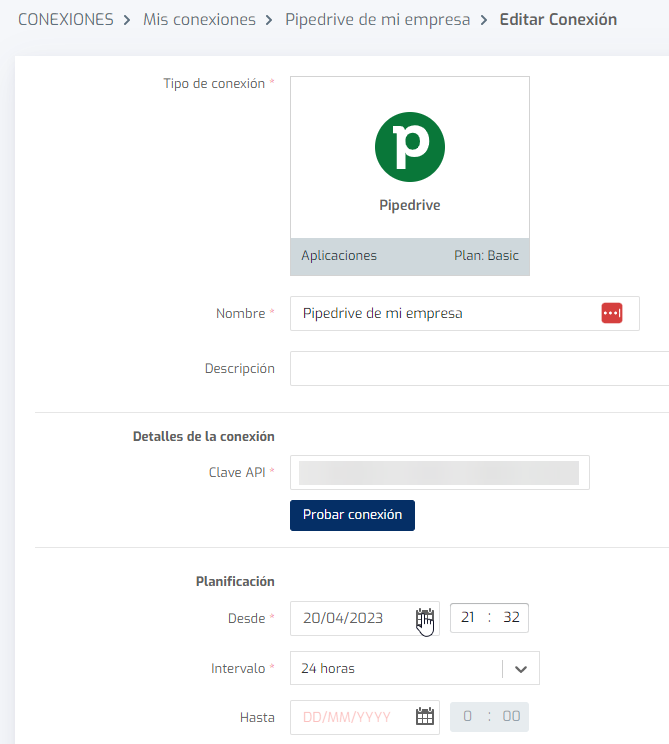
Pipedrive allows you to customize each account with custom fields in the Deals, Persons and Products entities. If you need to analyze these custom fields as well, feel free to contact us to help you get them set up in your Biuwer account.
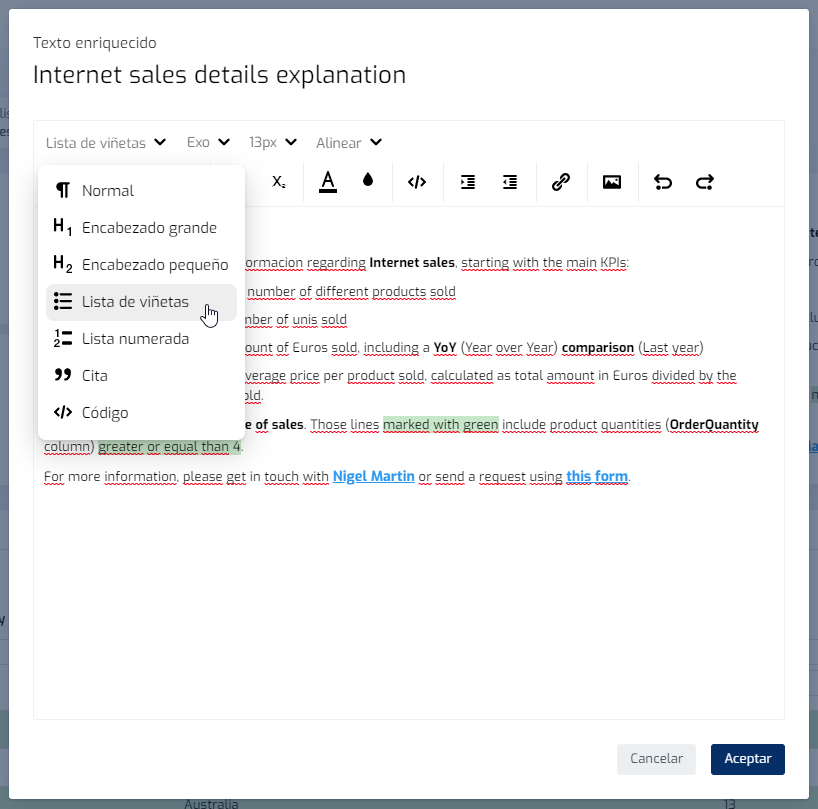
- New type of card, Rich Text. You can now expand with explanations and content blocks in Biuwer! Until now all cards in Biuwer were data cards, i.e. they serve to show data in one way or another in a visual form. The Rich Text card is the first content card that does not represent data (for the moment :)). Here is an example:
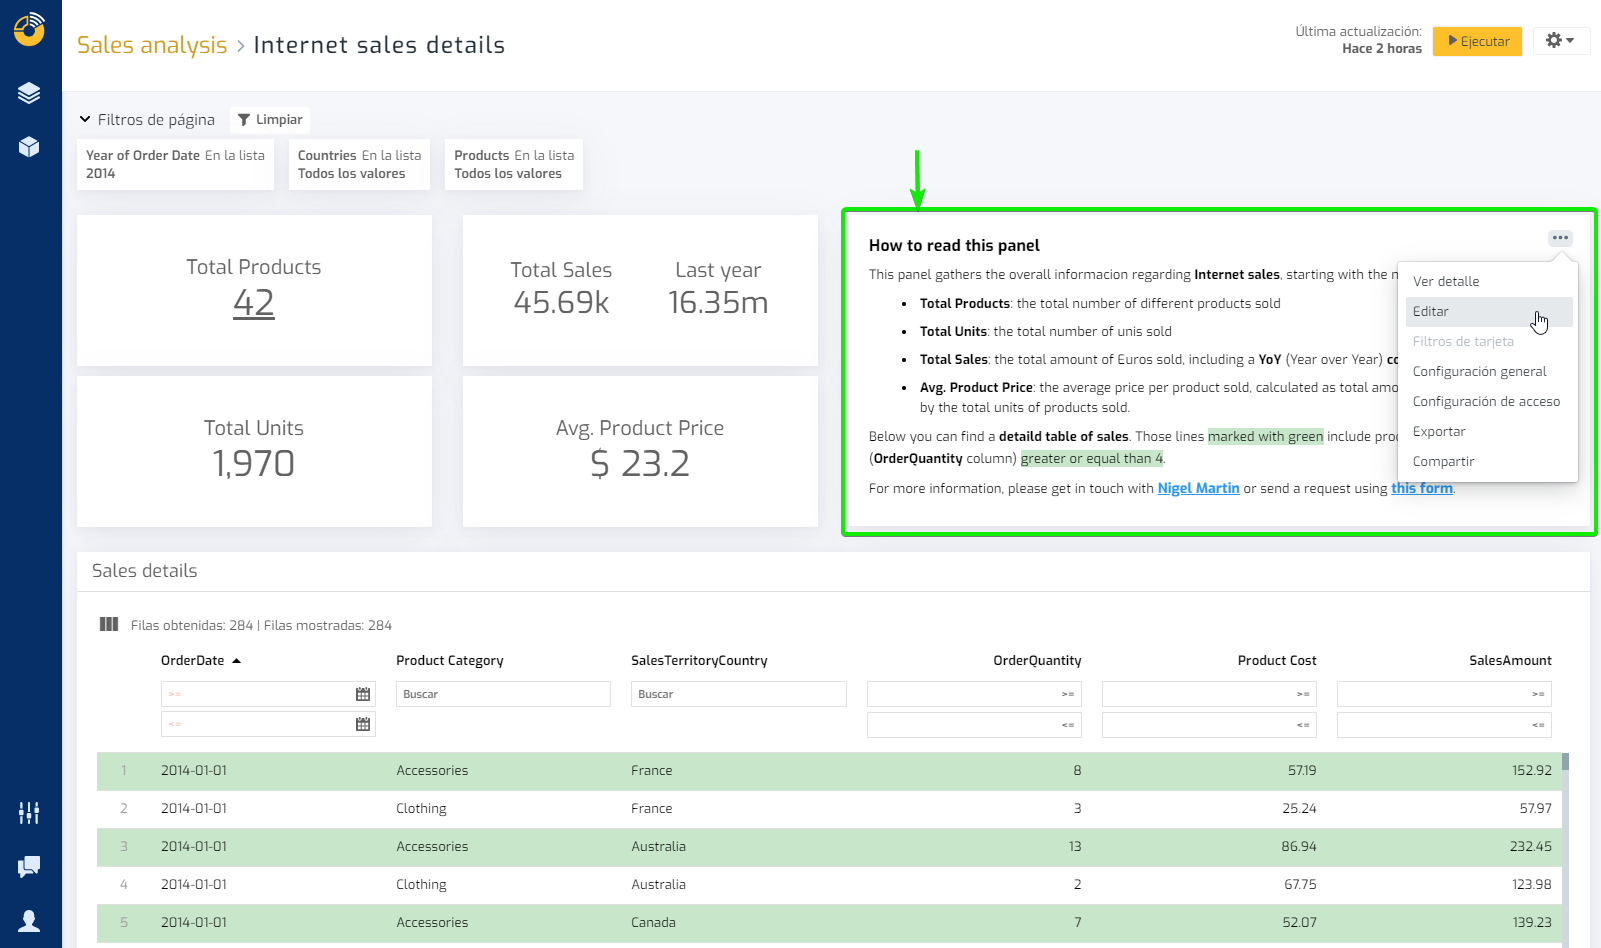
How does it work? You have a rich text editor with many options to give free rein to your imagination, from normal text, titles, lists, quotes, code, links, images... and all with different styles (bold, colors, indentations, alignments. ..). We look forward to seeing your creations!
Improvements:
- Improvement of the user activation and deactivation process, with application to all dependent elements.
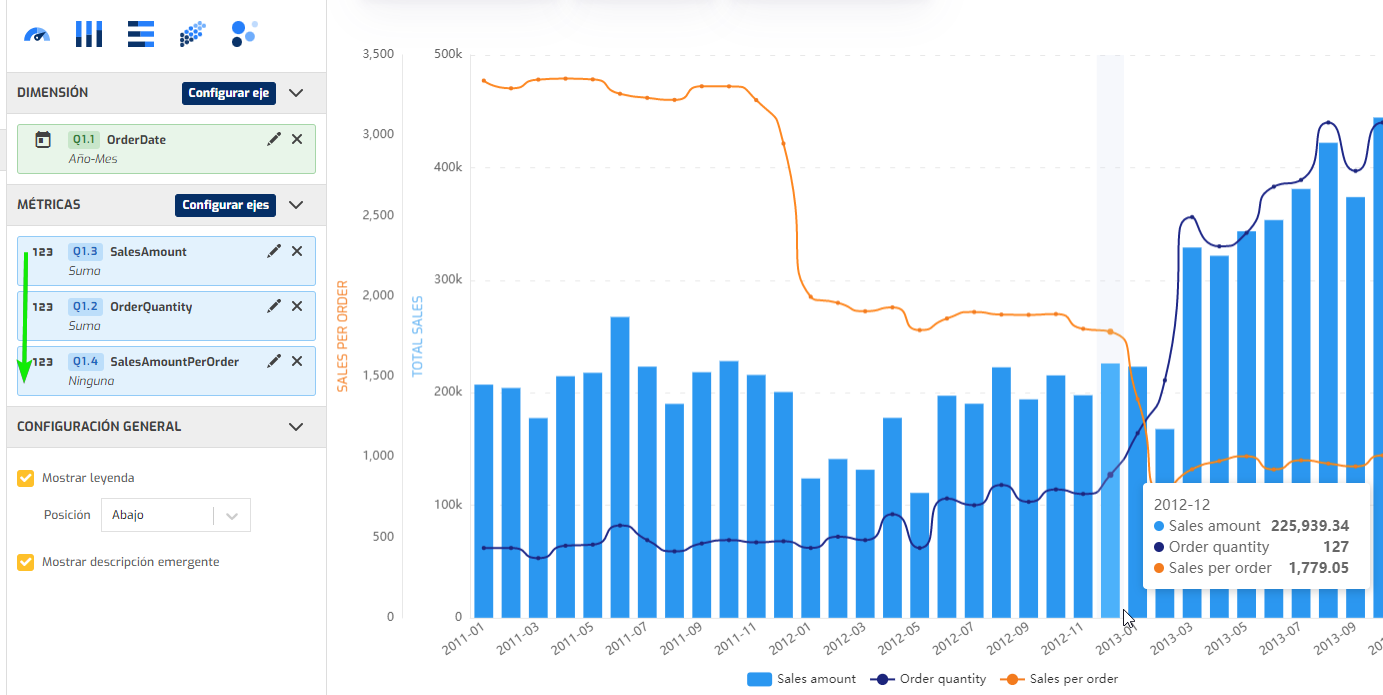
- Added the ability to reorder fields of metric type on chart cards. This allows fine control over which visual elements are displayed in front or behind.
Bug fixes:
- The default styles of the Data Labels in funnel-type charts have been correctly applied.
- Fixed error when printing PDF pages with separators.
- Other minor fixes.
March 2023
New functionalities:
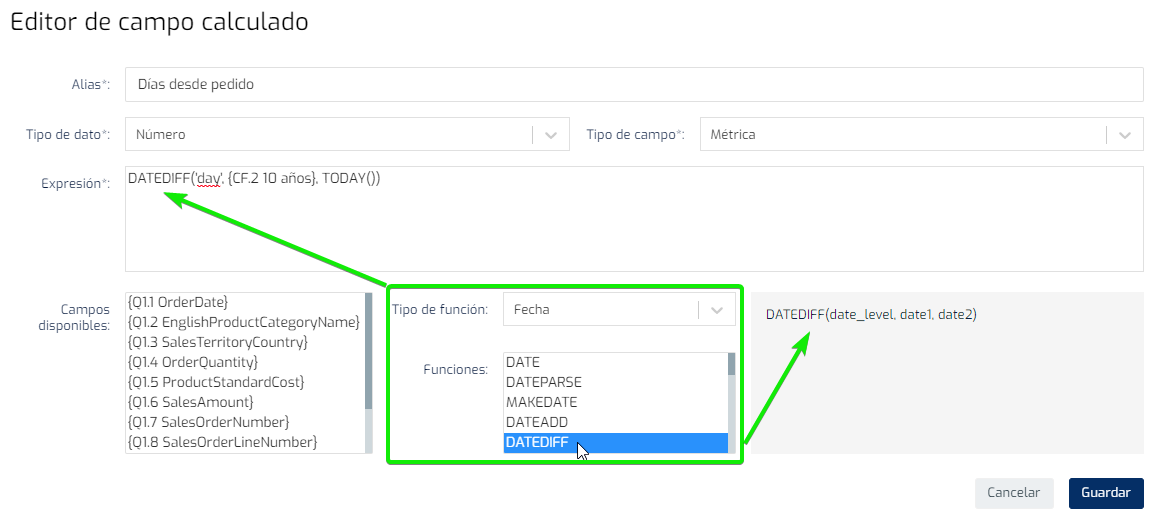
- Date functions are now available in Calculated Fields. The Data Card Editor continues to be improved, now including a set of functions to operate with dates in the expressions of the card Calculated Fields. The possible combinations and options are many using the new functions: DATE, DATEPARSE, MAKEDATE, DATEADD, DATEDIFF, DATEDIFF, DATENAME, DATEPART, DATETRUNC, YEAR, QUARTER, MONTH, WEEK, WEEK, DAY, ISOYEAR, ISOWEEK, TODAY, ISDATE. In addition, the functions MAX, MIN can also be used with date fields, to obtain the corresponding maximum and minimum dates. Keep in remind that you can also use the previously released functions for automatic comparison of metric fields in previous periods: PREV_YEAR, PREV_QUARTER, PREV_MONTH, PREV_WEEK, PREV_DATE. More information at Biuwer Docs.
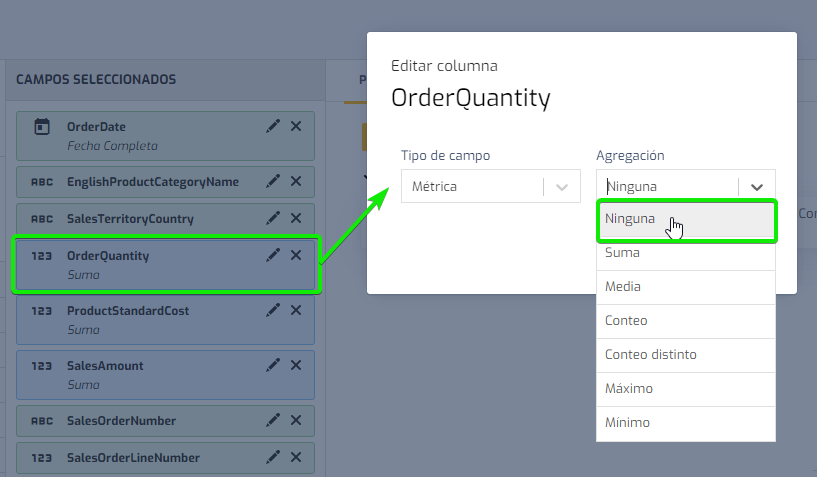
- NONE aggregation possibility on METRIC fields. Biuwer's automatic query engine until now always required an aggregation function for a metric field. If you know SQL it is the usual SUM, COUNT, AVG that is usually used in your data queries. However, there are cases where you want to not aggregate, i.e. get row by row data without aggregating. For example, if you want to visualize a scatter or bubble chart you may not want to aggregate the metric fields involved. This and other use cases are possible from now on with Biuwer.
Improvements:
- Several improvements have been introduced in the Biuwer Public API. Since this update you can now manage all the security settings, both in the access to the content (Shared Spaces, Pages, Cards, Collections) and to the data itself, through the Data Policies. In other words, the Biuwer API now allows you to manage Data Policies, Spaces, Pages, Cards, Collections objects.
- The Google Ads connector has been updated to the latest version of the API provided by Google.
- We have improved error handling, including visual elements when errors occur. This makes it easier for users to contact support and at the same time we can solve any issues more quickly.
- We have improved Scatter / Bubble plots, with support for aggregated or unaggregated metrics on either the X or Y axis.
Bug fixes:
- Fixed the problem that caused that totals (SUM, COUNT, AVG, MIN, MAX...) defined in vertical tables on metric columns obtained from dimension fields, did not work correctly.
- In charts, the legend is displayed correctly in "Right" and "Left" positions.
- Some details have been fixed in the funnel chart, such as displaying correctly the data label in percentage and the data sorting.
- Other minor fixes.
February 2023
New functionalities:
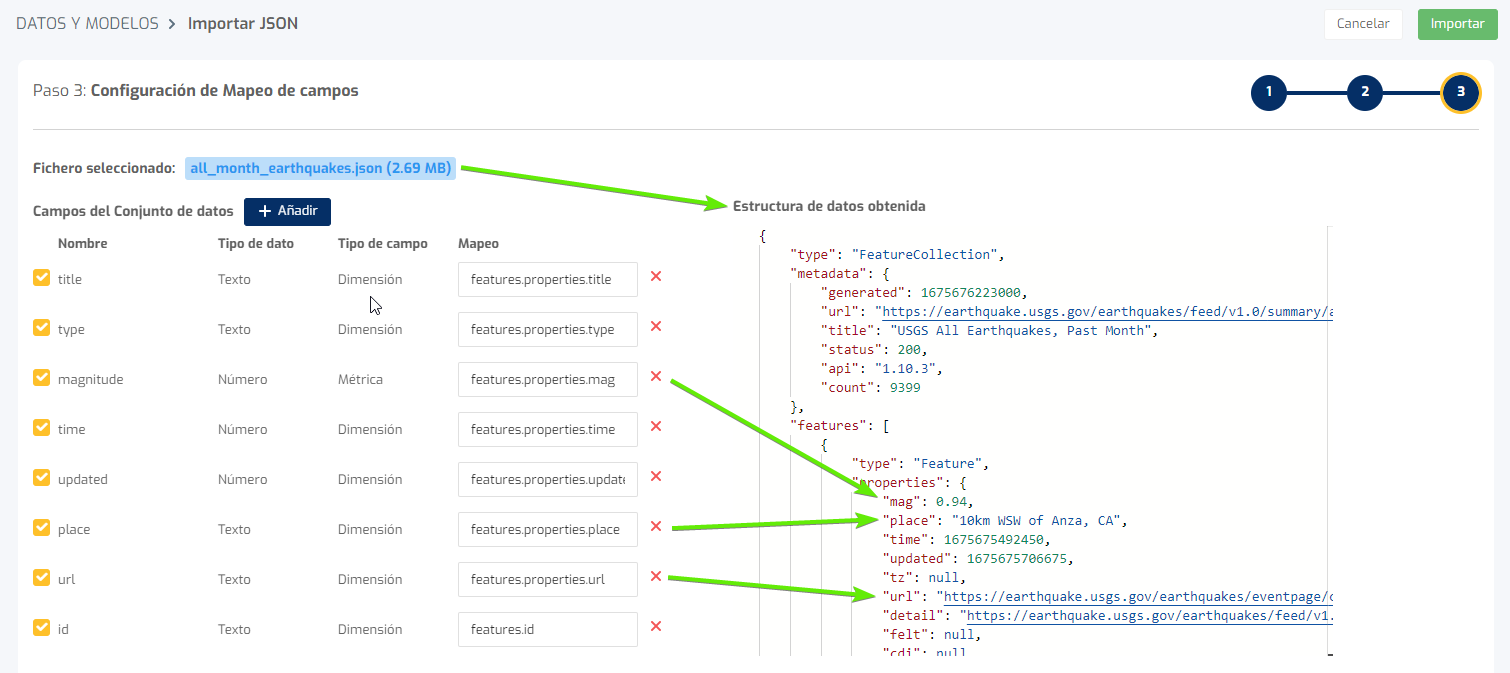
- New JSON files connector. More and more data is obtained in JSON (JavaScript Object Notation) format, such as those that REST or GraphQL APIs return to us when using them. From now on, you can analyze this type of data in Biuwer with the new connector to JSON files. To do this, after uploading the JSON file, you have to configure a field mapping, in a flexible way as shown in this example.
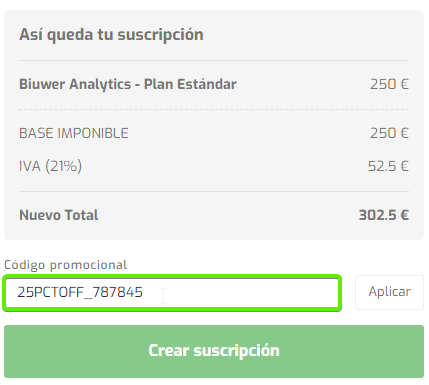
- Promotional codes in Biuwer. Don't have your promotional code to start using Biuwer? Contact us, book a meeting, ping us on Social Networks and if your company applies, we will give you a promotional code with which you will get a discount to apply when you buy your plan in Biuwer.
Improvements:
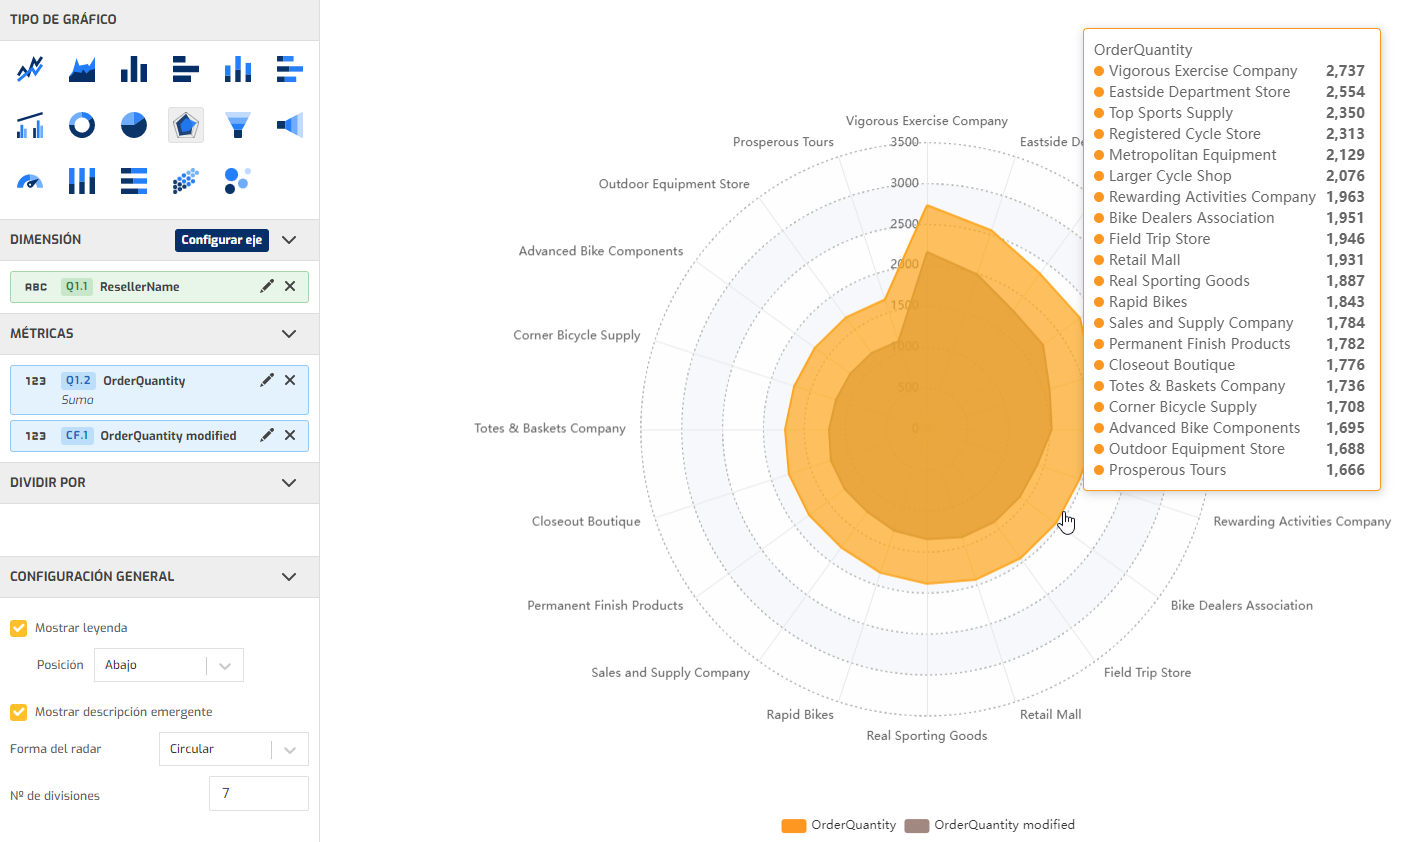
- Radar chart. Several improvements introduced in radar type charts, with support for multiple series, calculated fields, axis configuration, radar shape, divisions to display, etc.
- Improved visualization of data labels in charts that intelligently avoids overlapping.
- Number formats in chart tooltips.
- Improvements have been made for reverse engineering connections to MongoDB over cluster in Mongo Atlas.
- Improvement in the management of groups of users, both from the Biuwer web application and from the public API.
- The "Row limit reached" warning is showed in the Data Card Editor, when the row limitation is configured and it is reached.
- Improved printing of content in Embedded Analytics mode.
Bug fixes:
- Fixed mismatches in conditional formats and filters applied by URL parameters on boolean fields.
- Fixed dependencies for deleting connections to Cloud files (Google Sheets, Notion, etc.)
- Other minor fixes.
January 2023
New functionalities:
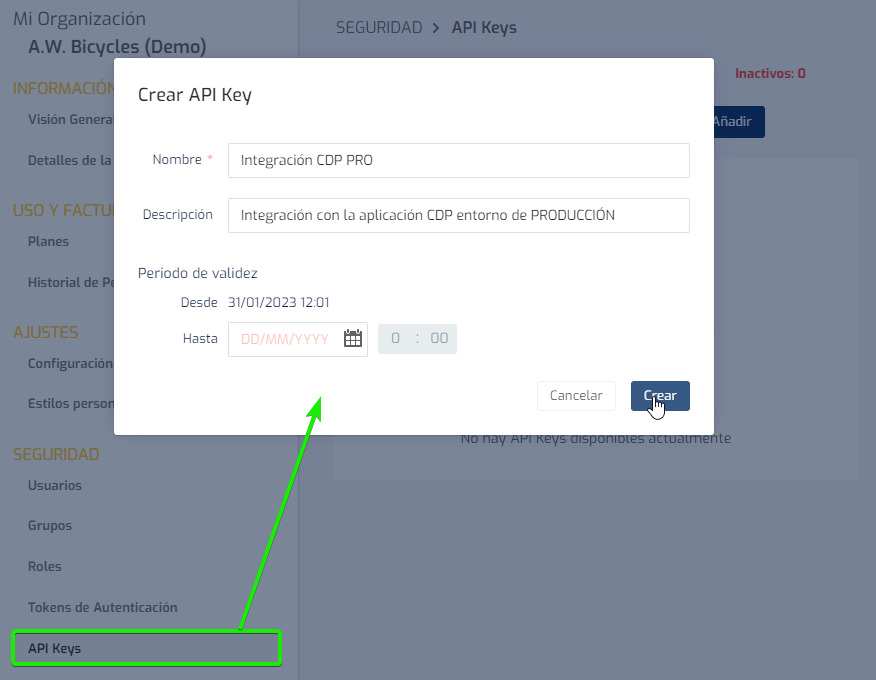
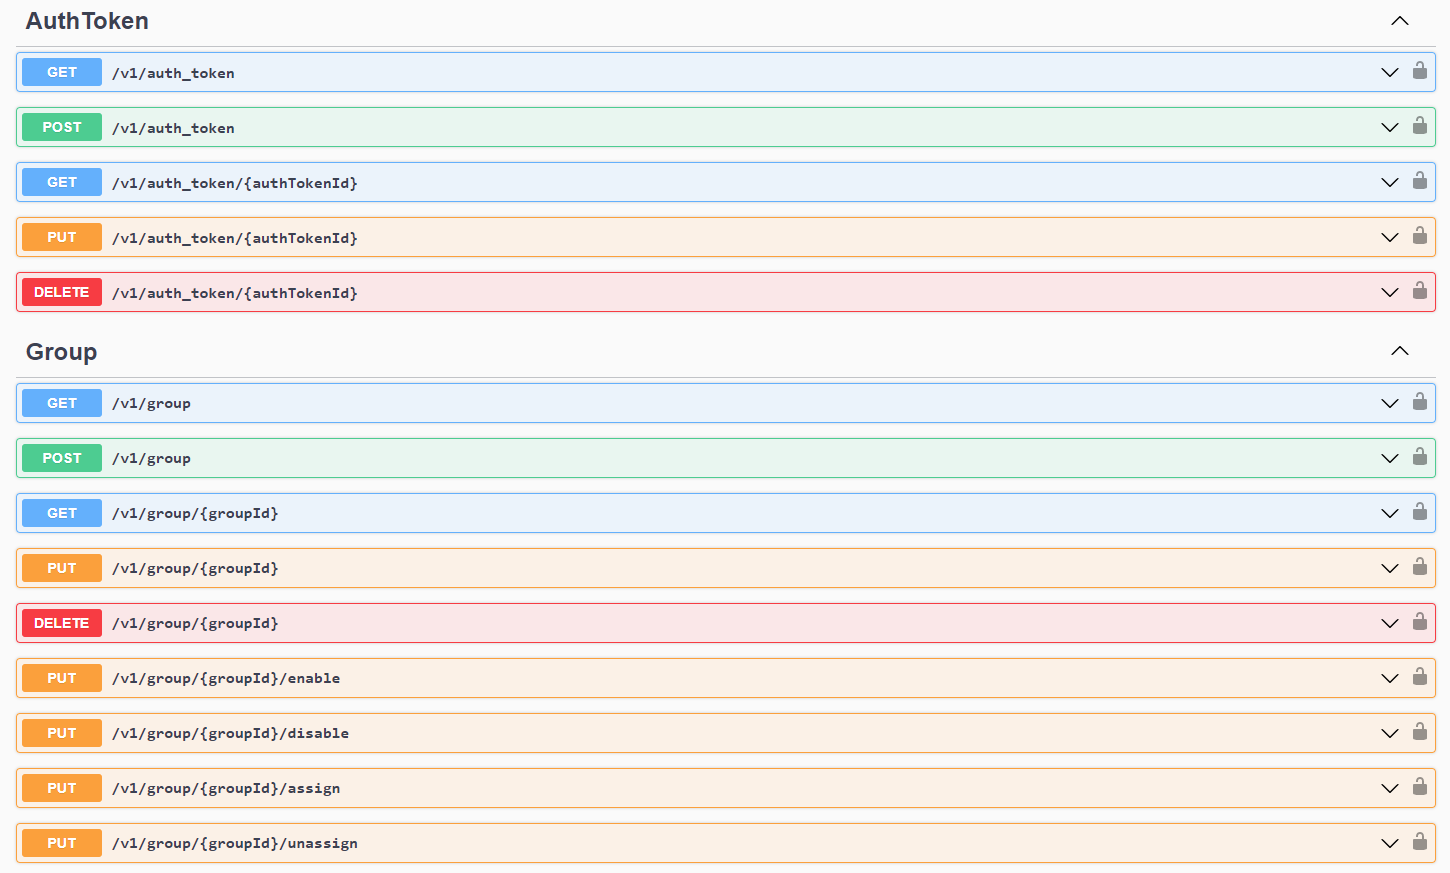
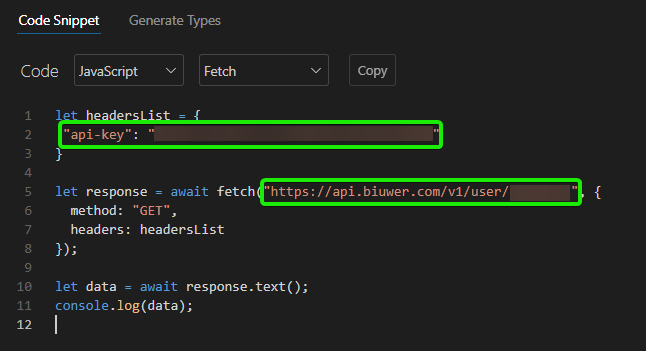
- Biuwer Public API is now available. This functionality marks a before and after in the integration possibilities of Biuwer in external applications, since it allows automating the management of all those tasks related to user management, authentication tokens, user groups, configuration of data and content permissions, etc. How is it used? The first step is to configure an API KEY in the Biuwer administration area. Subsequently, in any web application, include the API KEY in the header in the HTTP calls, for the different endpoints available in the public API. Use the base URL https://api.biuwer.com/ to compose the calls to Biuwer's public API. We are expanding support to be able to work with other parts of the Biuwer platform through the API and thus be able to automate integrations with third-party applications (Embedded Analytics).
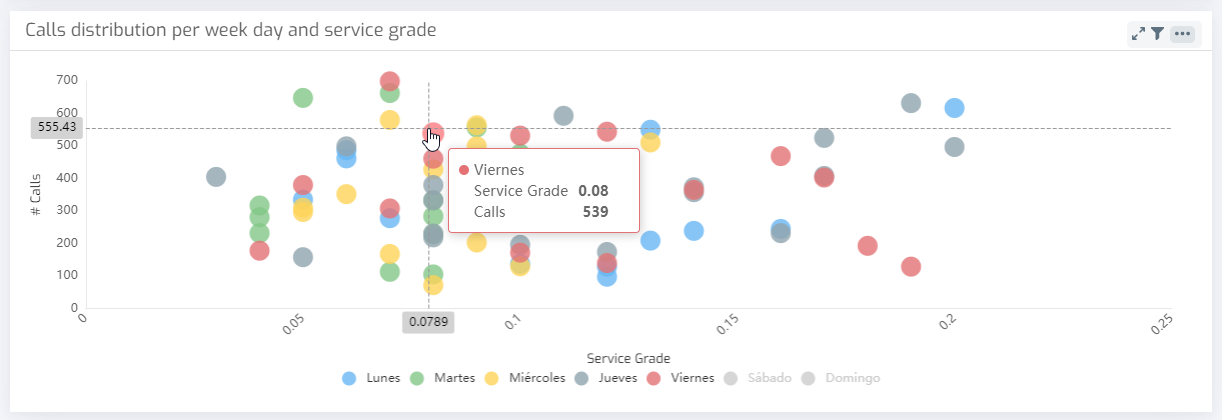
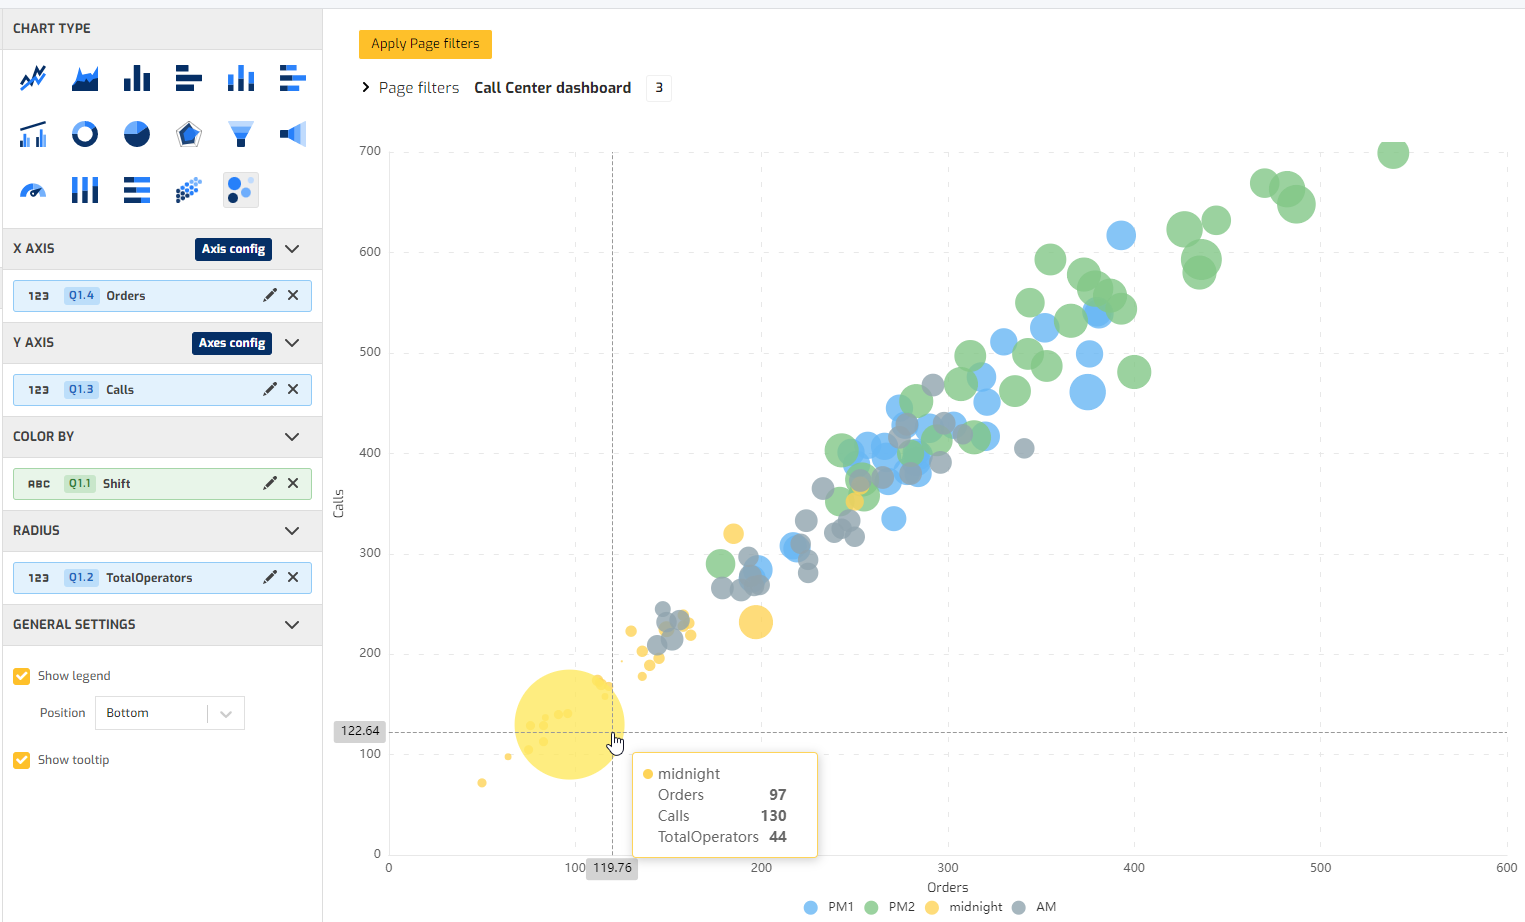
- New chart types: scatter plots and bubbles charts. With these two types of charts, visual analysis can be performed on the values taken by two or more fields of a Dataset. Specifically, these visualizations allow the user to search for relationships between different variables. These charts display your data as points or circles on a chart using the X (horizontal) and Y (vertical) axes. The use cases are multiple, such as finding atypical values (outliers), direct and inverse correlations, trends, etc..
Improvements:
-
Filtering system: better assignment of filters to data cards with multiple queries.
-
Data Blending: improvements in the data blending system between several queries of data inside each card, with support to various types of fields.
-
Chart cards: improvements while interchanging between the various chart types available.
Bug fixes:
- Data Card Editor: users can now delete fields in the data card editor even if there are errors in any calculated field, as well as fields that are being used in visualizations.
- Numeric formats for currencies in charts have been adjusted.
- Basic users have access to visualize maps data cards.
- Other minor fixes.
December 2022
New functionalities:
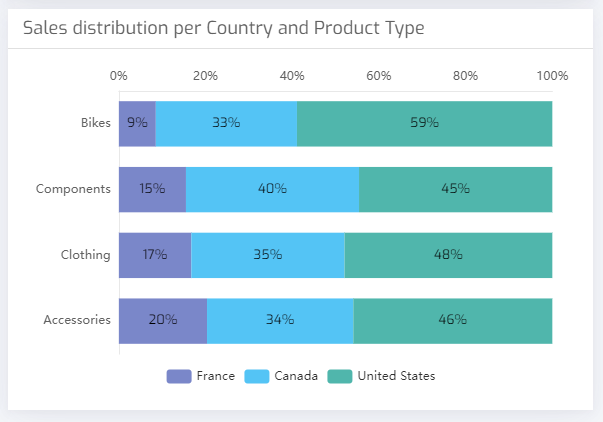
- 100% stacked bar charts. With this new type of chart you can easily visualize the distribution of values that any metric takes in Biuwer. The chart automatically calculates the weight that each value has over the total. You can configure how to display the labels and tooltips, both in vertical and horizontal format.
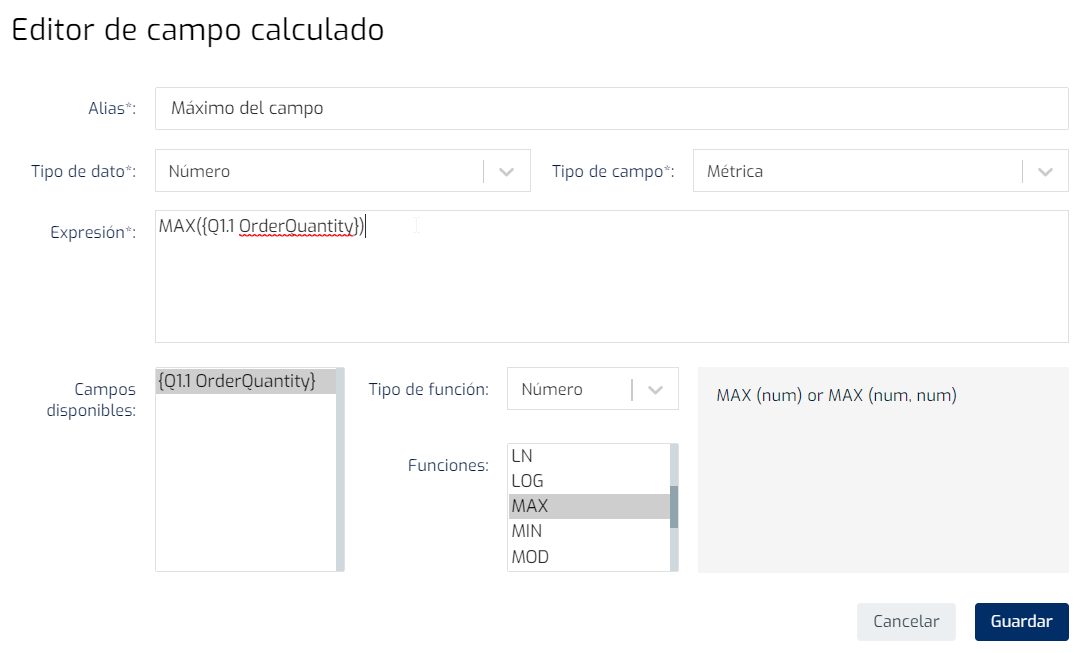
- New numeric operators available in Card Editor expressions. The following operators are now available: ABS, CEILING, DIV, EXP, FLOOR, LN, LOG, MAX (of a field or between two values), MIN (of a field or between two values), MOD, POWER, ROUND, SIGN, SQRT, SQUARE. For more information, check out our documentation site and tutorials.
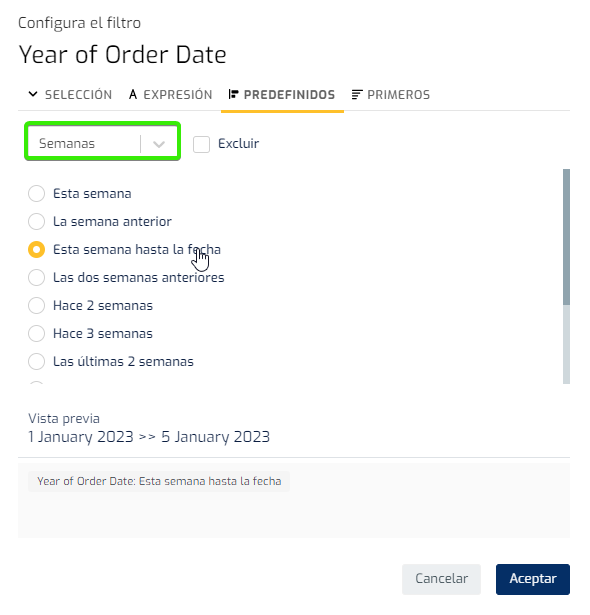
- New Week level available in the filter system and new special values "to date". With this novelty, users can now analyze weekly periods more easily. Among the added options are: “This week”, “Last week” or “The last 2, 3, 4, 6, 8 and 12 weeks”. Special periods have also been included: “Week to date” (WTD), “Month to date” (MTD), “Quarter to date” (QTD) and “Year to date” (YTD).
Improvements:
-
Card printing: From now on the title of the card is shown. Until now, when a user exported a card, the name of the card was used, which is not bad, but sometimes it is used internally by the content manager to identify or differentiate between cards.
-
Improvements in the Biuwer charting system, with which better use is made of the available spaces in general and especially in the axes that have been configured.
-
Support for applying filters to multiple queries when duplicating pages and cards is now available.
Bug fixes:
- Tooltip on table actions: The full cell value is now correctly displayed when hovering over values in fields where a navigation action has been configured.
- Chart label colors: The default colors are now displayed correctly in chart labels in all cases.
- Fixed a problem when creating calculated fields in data sets managed by Biuwer.
- Other minor fixes.
November 2022
New functionalities:
- New "Speedometer" chart type. To show the value of KPIs in a visual way, you can create semicircular or circular speedometers, with several configuration options.
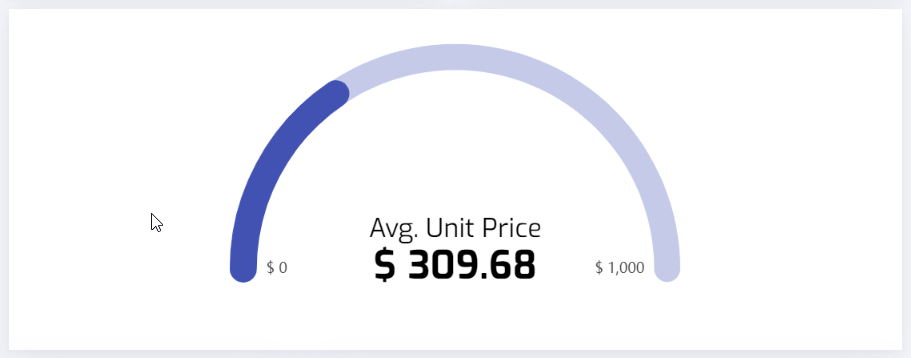
This type of graph allows you to show the achievement of objectives, percentages, etc. in a very visual way.
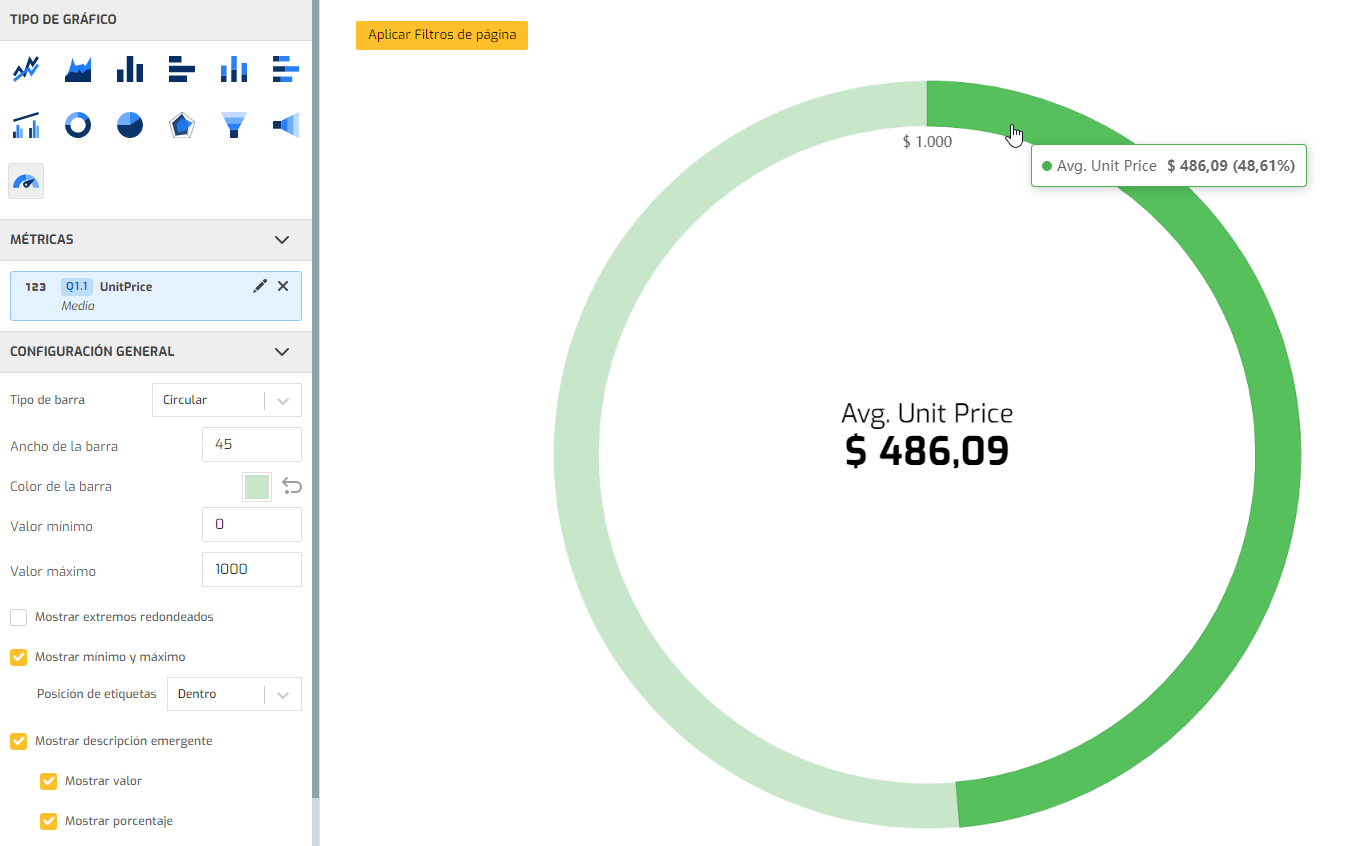
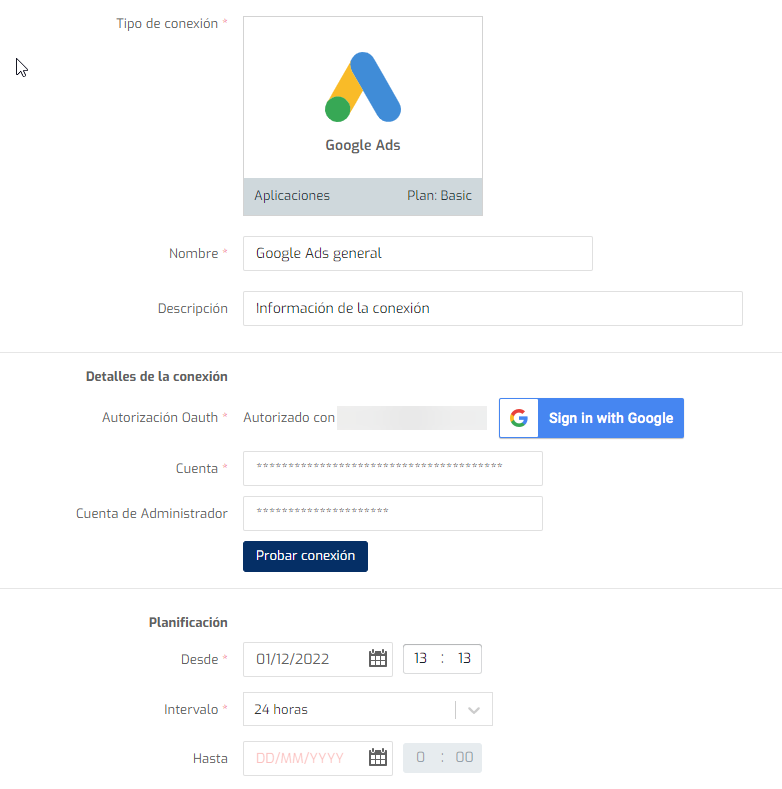
- New “Google Ads” connector. By connecting your Google Ads accounts in Biuwer, you have all the data you need to** improve the performance of your ad campaigns** on the Google network, such as clicks, CPC (cost per click), cost per ad and campaign, conversion rate, conversions obtained, cost per conversion ratio, etc.
-
Incorporation of special numerical functions (percentage over total, accumulated value, etc.) in the Card Calculated Fields. More information at Biuwer docs.
-
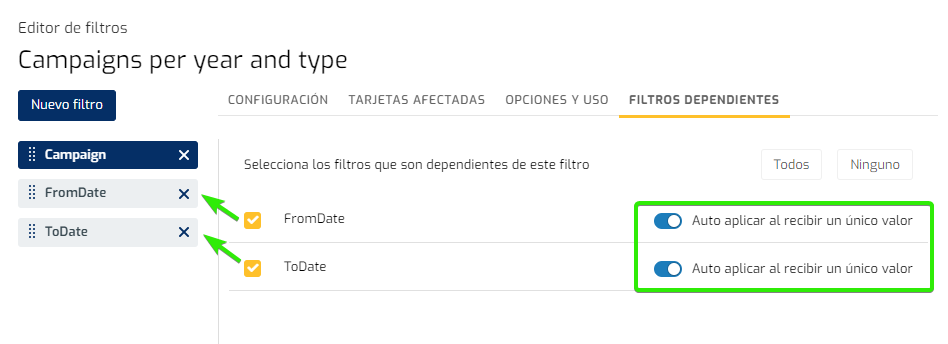
The Filter system allows to auto apply dependent filters when changing the parent filter to obtain a single value. This functionality allows implementing different use cases depending on the structure of the data, and visually facilitates the interaction of the end user, since filters can be hidden and applied automatically without having to do anything.
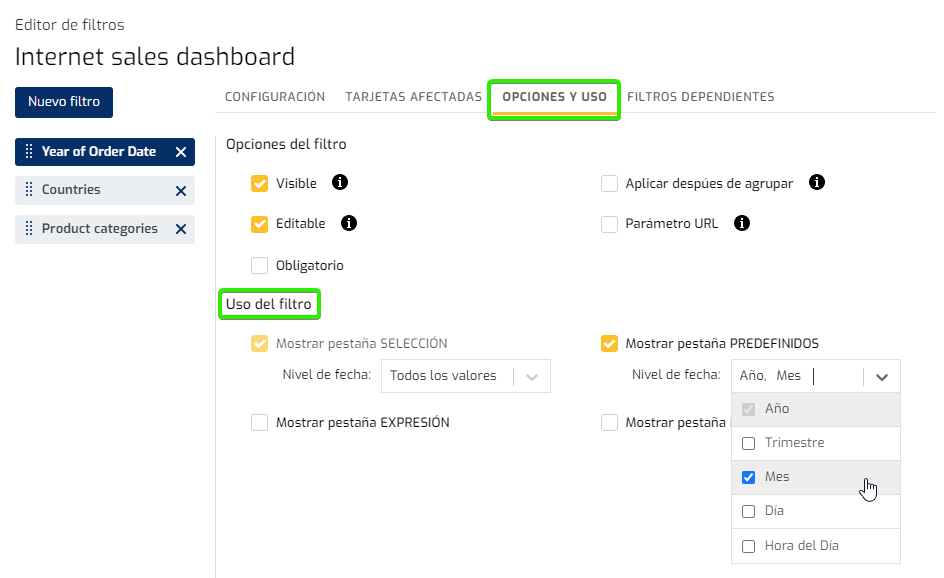
- You can now configure in the filters the options you want to allow users, i.e. the SELECTION, EXPRESSION, PRE-DEFINED and FIRST tabs, along with the allowed operators and date levels.
Improvements:
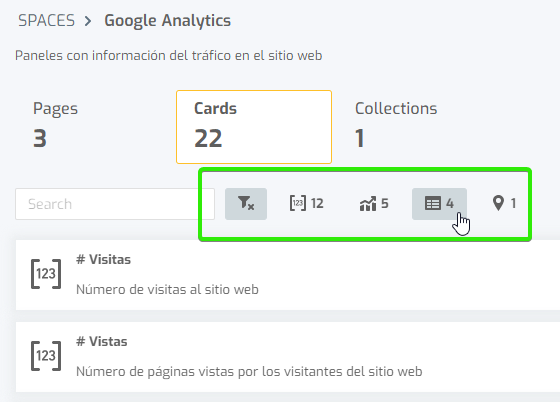
- Improved sorting and filtering of Pages and Collections. You can now filter Cards by type, quickly and visually.
-
Improved string handling in Card Calculated Fields expressions.
-
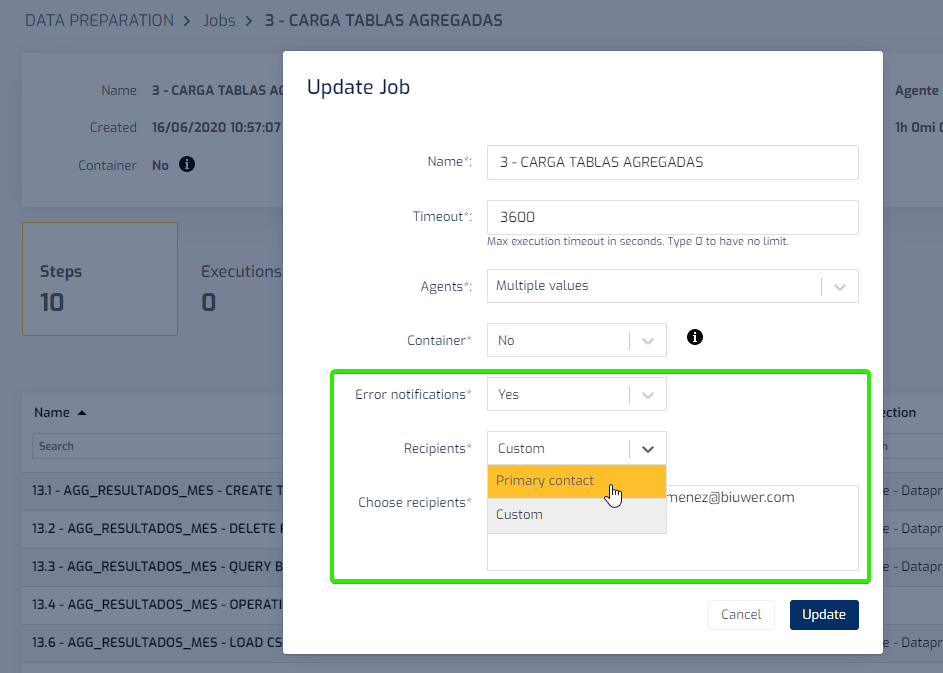
Possibility to receive informative email in case of job execution error, within the optional Data Preparation module. You can choose the main contact of your organization or write a list of email addresses.
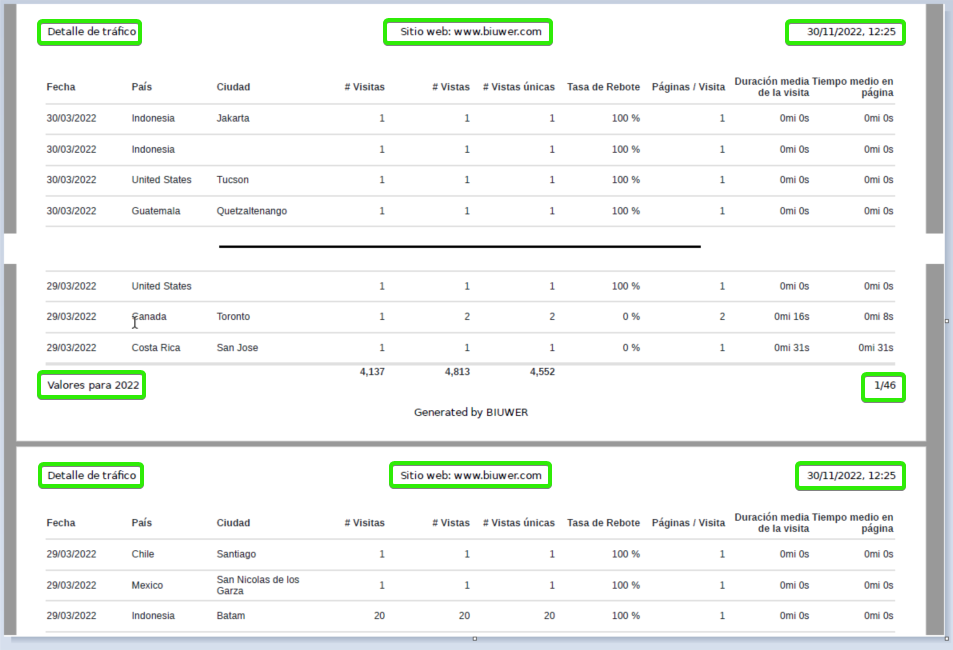
- Improved header and footer styling when exporting in PDF format.
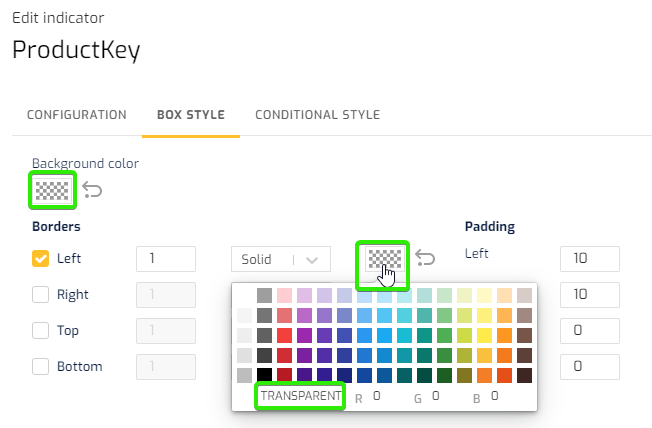
- Improved treatment of "transparent" color in data configurations.
- New chart icons. We have added a new visual catalog for chart types. New chart types available soon!
![]()
-
Updated authentication using Oauth 2 for the Hubspot CRM connector.
-
The Card Calculated Fields can now be used to set up conditional formats.
Bug fixes:
- Fixed a navigation error when canceling or returning in the Data Card Editor.
- Solution to flickering in vertical tables, in very specific situations of screen dimensions and browser zoom.
- Other minor fixes.
October 2022
New functionalities:
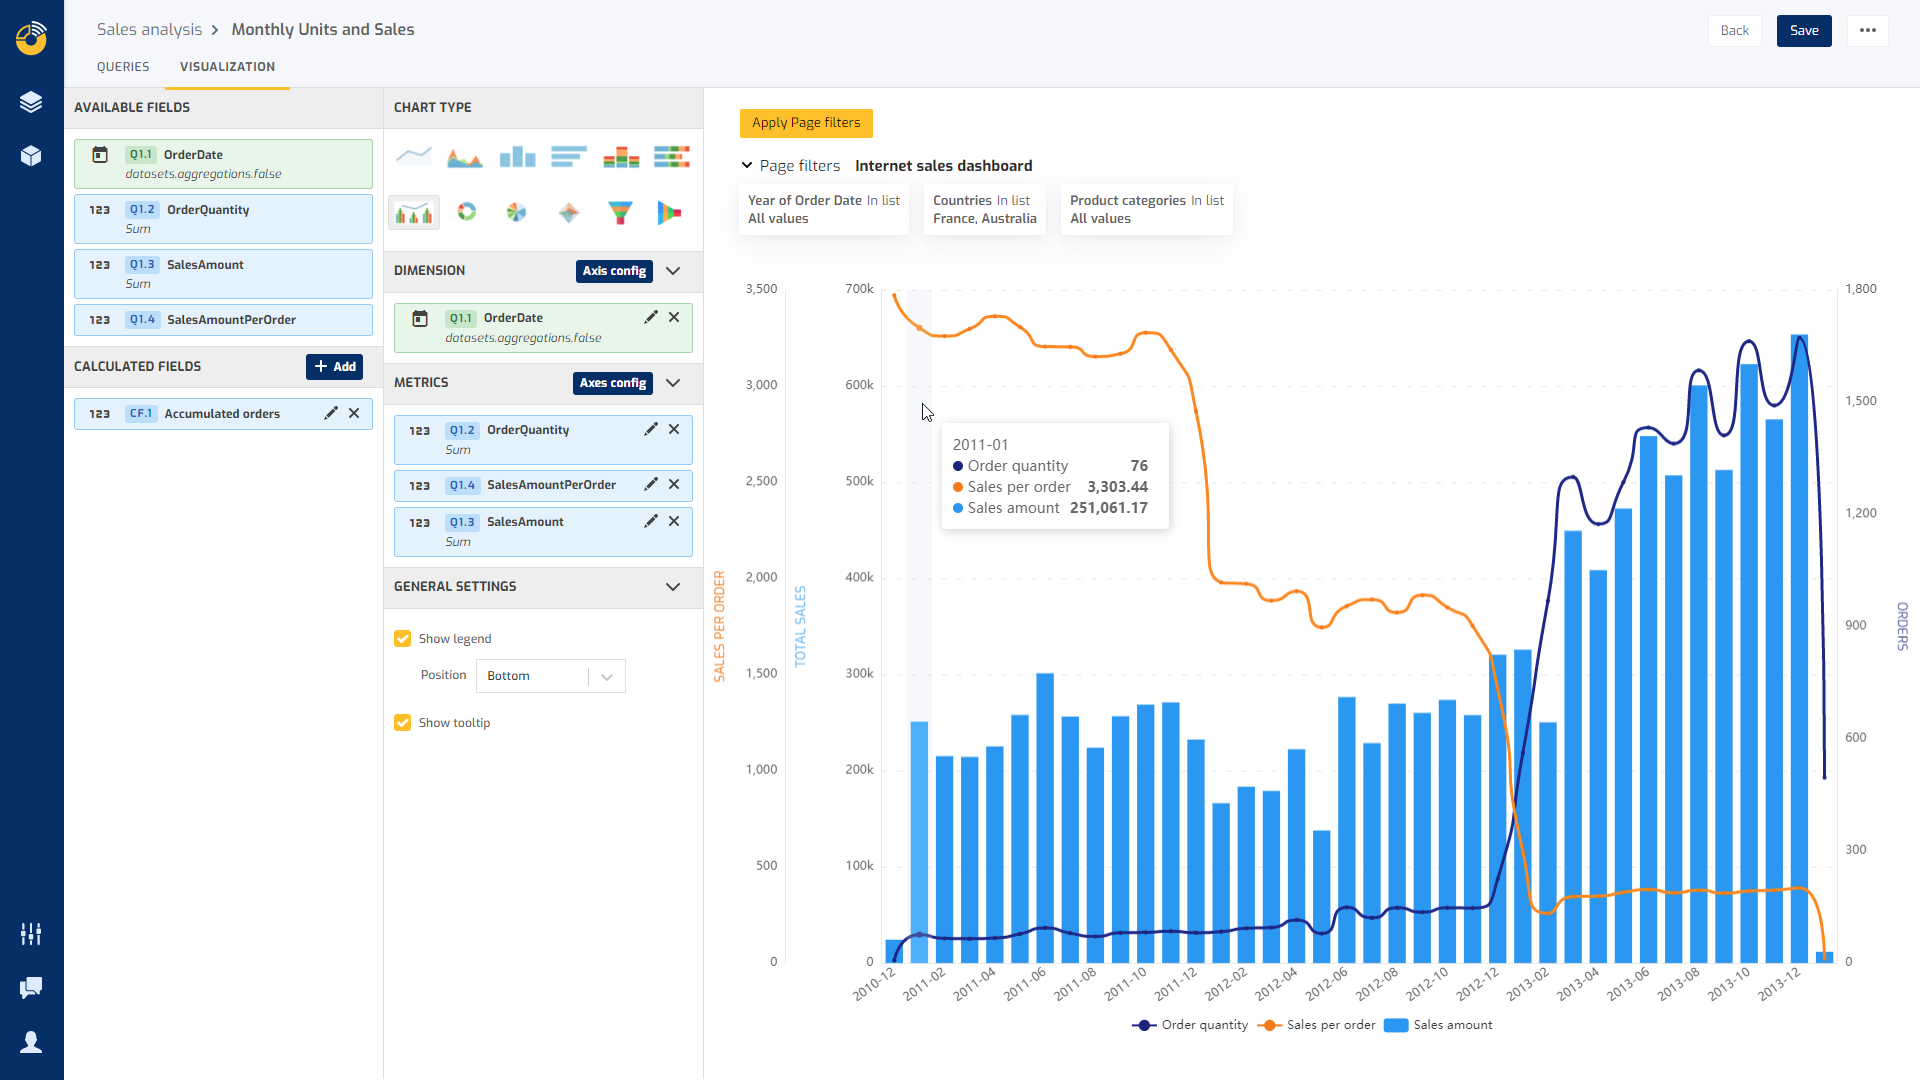
- New data card editor. After an intense period working on the new card editor and a new data usage system in Biuwer, this is certainly the biggest functionality update to date. In addition to the most noticeable, the new graphical user interface, a multitude of improvements have been introduced, such as the possibility to have multiple data queries on all cards, optimizations for advanced calculated fields o a reduction in the bandwidth required for data, a considerable 60% lower than before.
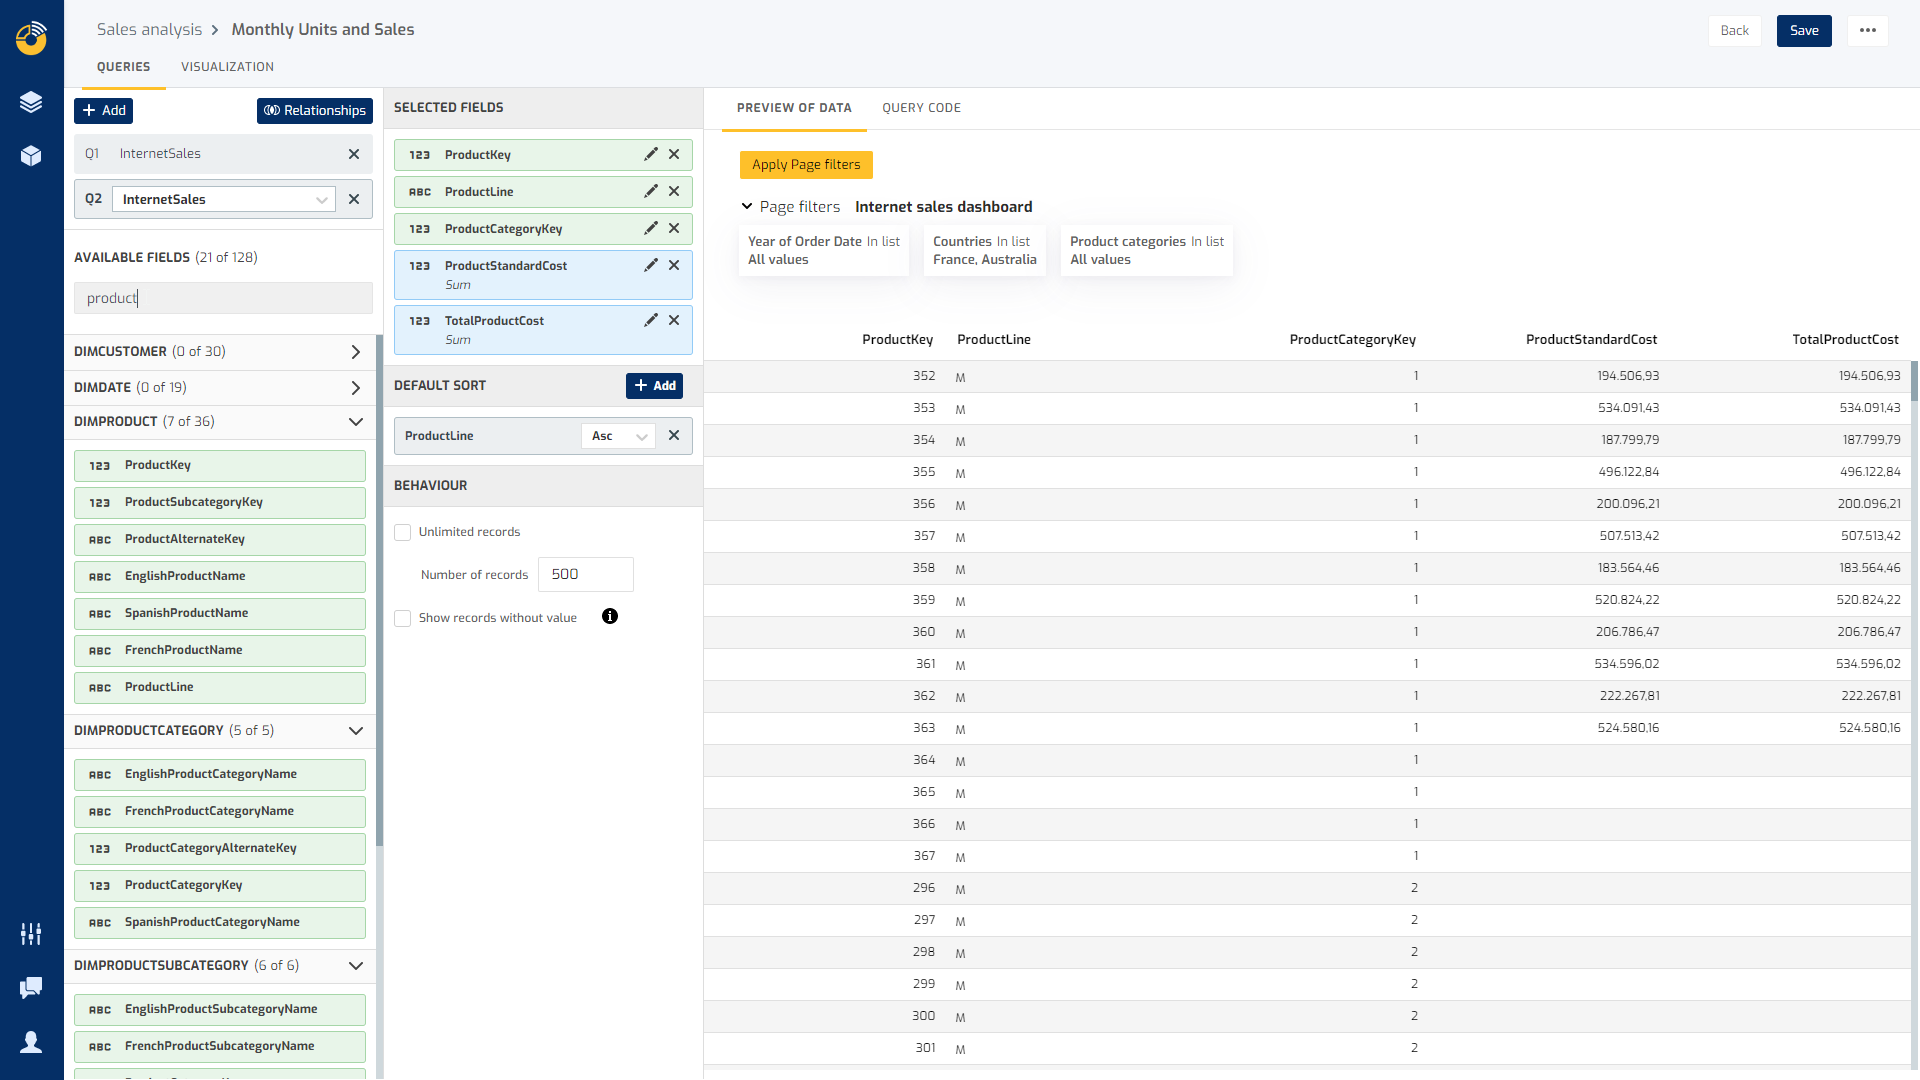
- Combination of Data (Data Blending). We often have data scattered in different sources (databases, files, cloud applications, APIs) and we want to cross-reference different data in a calculation. This functionality is called Data Blending and is now available together with the new card editor. Simply set up two or more queries and specify how you want to combine the data so that you can use the fields directly or in calculated fields. The possibilities are literally endless: ratios, differences, time evolutions, accumulated, percentages with respect to totals, etc.
Bug fixes:
- SSH connections: When connecting to data sources that are databases, a problem with connection via SSH in bastion mode, which in some cases did not work correctly, has been fixed.
- Other minor fixes.
September 2022
New functionalities:
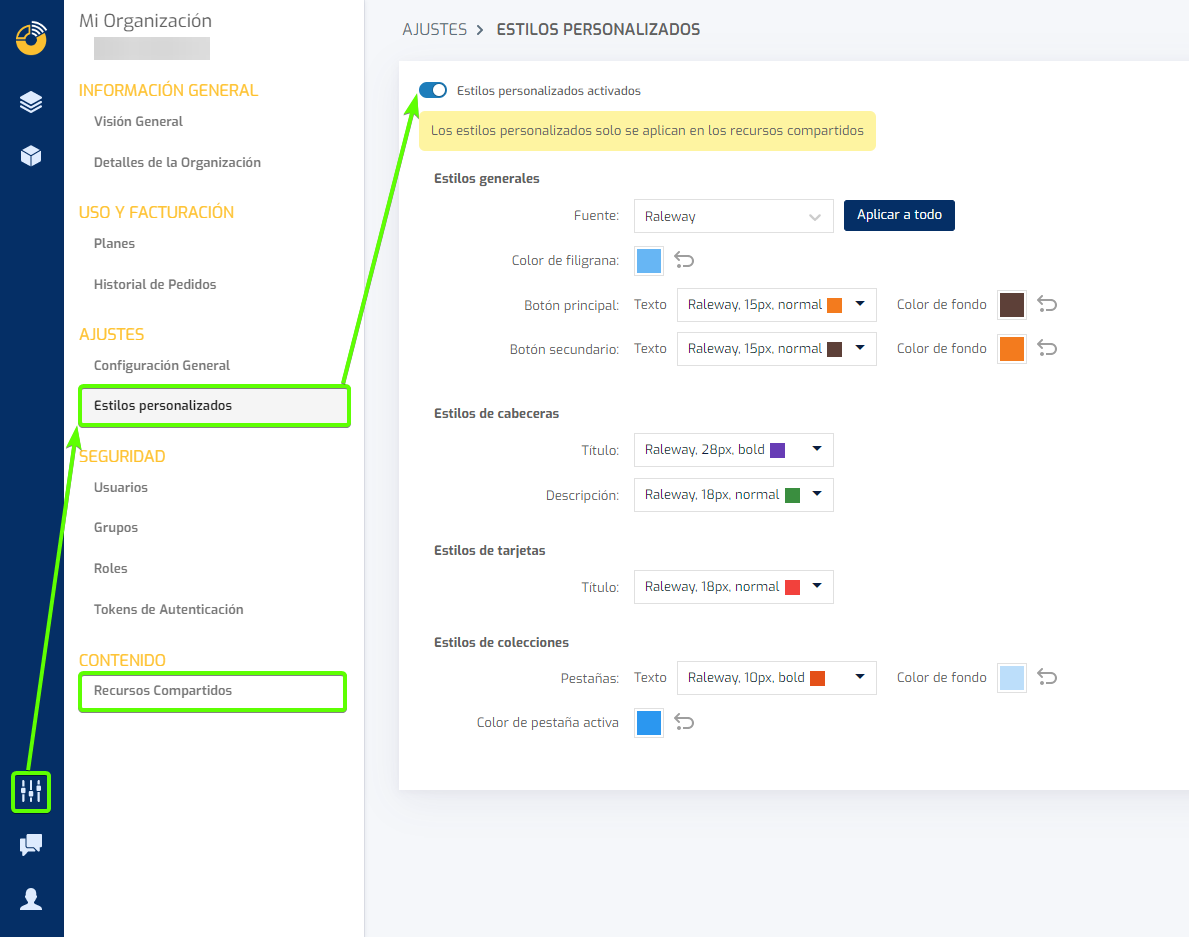
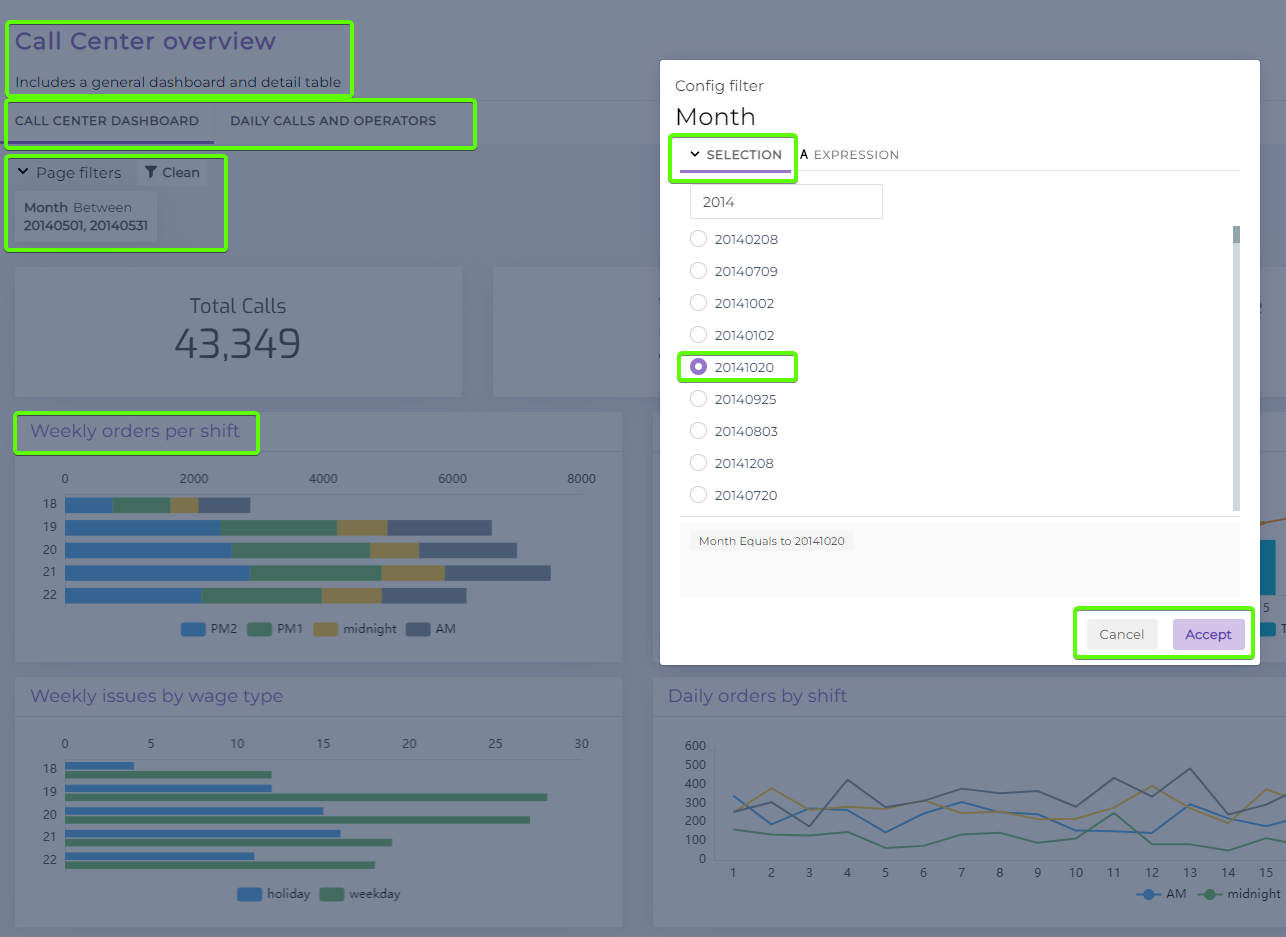
- Customized Organization Styles. Biuwer includes the ability to embed any data visualization in external web applications, through “Embedded Analytics” in a simple and secure way. We include the Custom Styles so that the visual integration is very similar between the dashboards made in Biuwer and the styles of your application. You can now customize fonts, colors, sizes, etc. at various Biuwer points. We will soon enable more custom styles, including CSS so you can further customize the look & feel.
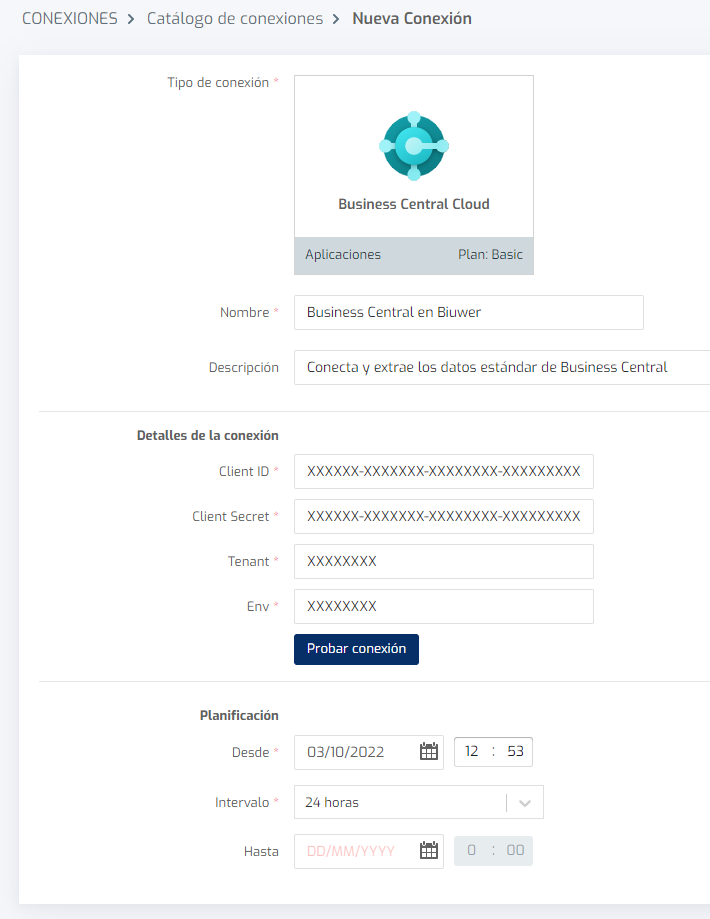
- New Microsoft Business Central connector: Business Central is an ERP/ CRM type tool for SMEs to manage their businesses in the cloud with which you can manage aspects of your company such as billing, accounting, projects, business opportunities or human resources. Business Central belongs to the Microsoft Dynamics 365 family of tools and was formerly known as Microsoft Navision. With this connector in Biuwer you will be able to analyze all the standard information you generate when using Business Central and perform a unified analysis with other data sources (applications, databases, files, etc.).
Improvements:
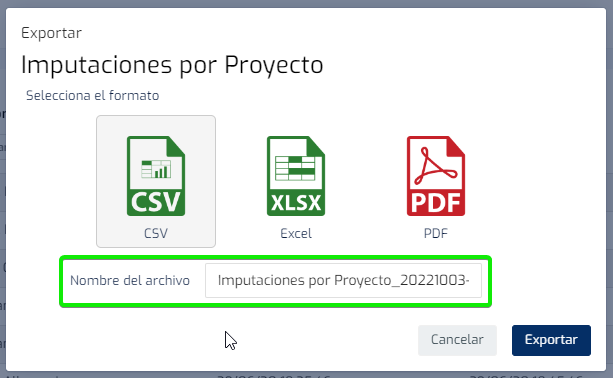
- Biuwer completes the file name when exporting data in CSV or Excel, as it does when exporting in PDF, with the name of the card and the current date.
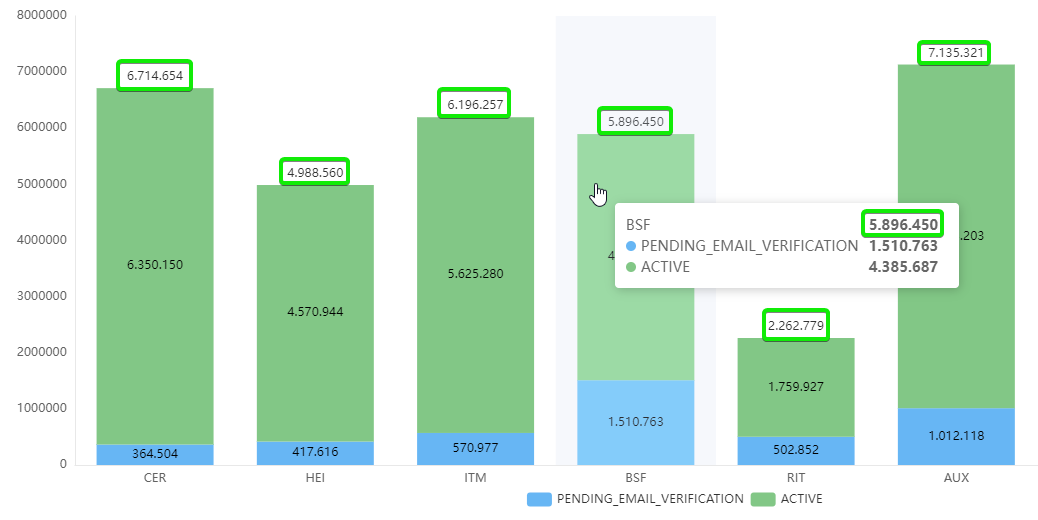
- In Biuwer charts, totals have been included in stacked bars and in the tooltips by checking the data labels option.
- For totals in vertical tables, the predefined numerical formulas in tables now take into account unexpected values in the data (Null, NaN, Undefined, Infinity) to obtain the expected total value in all cases.
Bug fixes:
- Year-week format is included when exporting data via CSV, Excel or PDF.
- Values obtained by calculated fields in cards when exporting data by CSV, Excel or PDF are included in all cases.
- Date queries in YYYY-WW format have been adjusted in MongoDB, using the isoWeek week format.
- Other minor fixes.
July 2022
New functionalities:
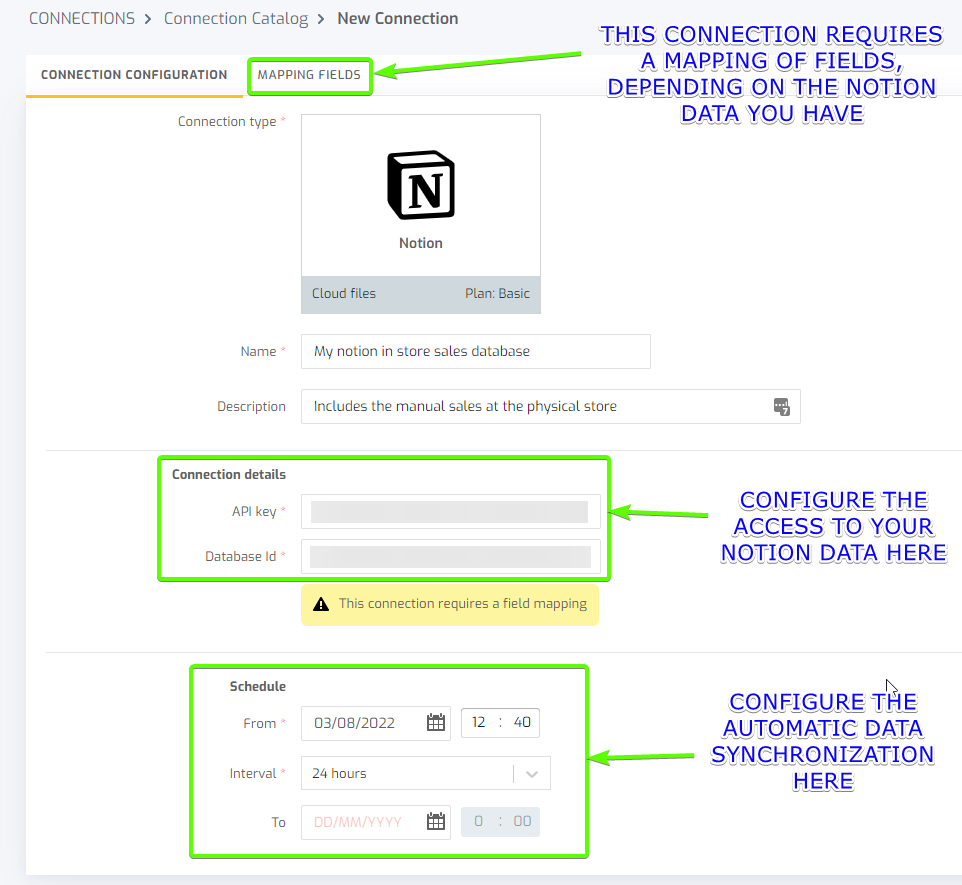
- New "Notion" connector. Are you a Notion user and need to analyze in detail the data you manage in this tool? From now on, you can create a connection in Biuwer that automatically synchronizes the data contained in any Notion data table. Set the update periodicity, analyze and share Notion data together with other data sources in a single place.
- Customized maps for an organization: We have included as a new functionality in map cards, the option to configure custom polygon maps that are private for a specific Organization. This way you can use Biuwer maps for very specific use cases with polygons that you define in your project. For example, map of areas of a city, map of international sales distribution, map of census tracts of specific cities, map of neighborhoods, etc.
Do you need a customized map? Contact us and we will help you to set it up in Biuwer.
Improvements:
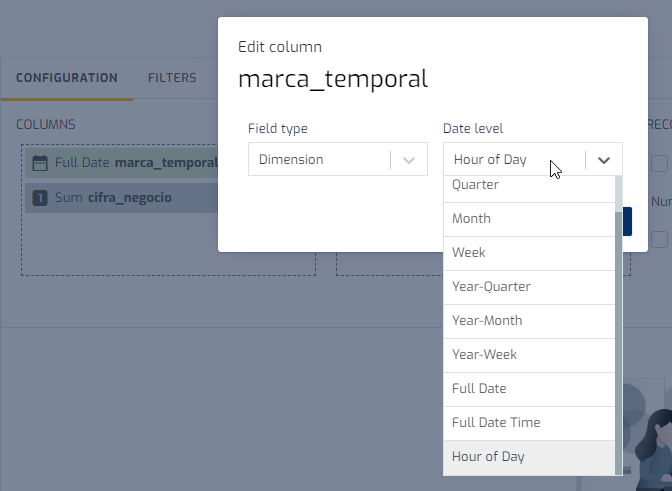
- Time-of-day level analysis on Datasets managed by Biuwer: From now on the date and time fields of Datasets managed by Biuwer allow you to choose the time of day level, so you can go into detail to analyze, for example, which are the busiest times of the day, sales or incidents (depending on your industry and project).
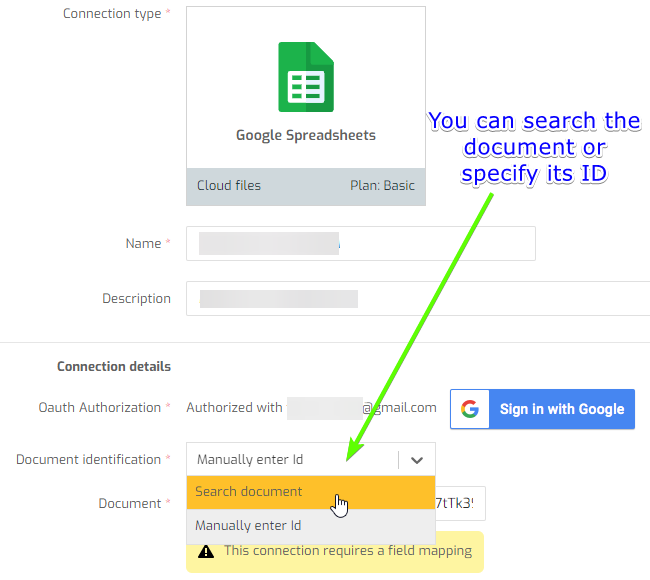
- Google Sheets connection: In addition to being able to locate your Google Sheet documents using a simple search engine, we have included the option to specify the document ID manually.
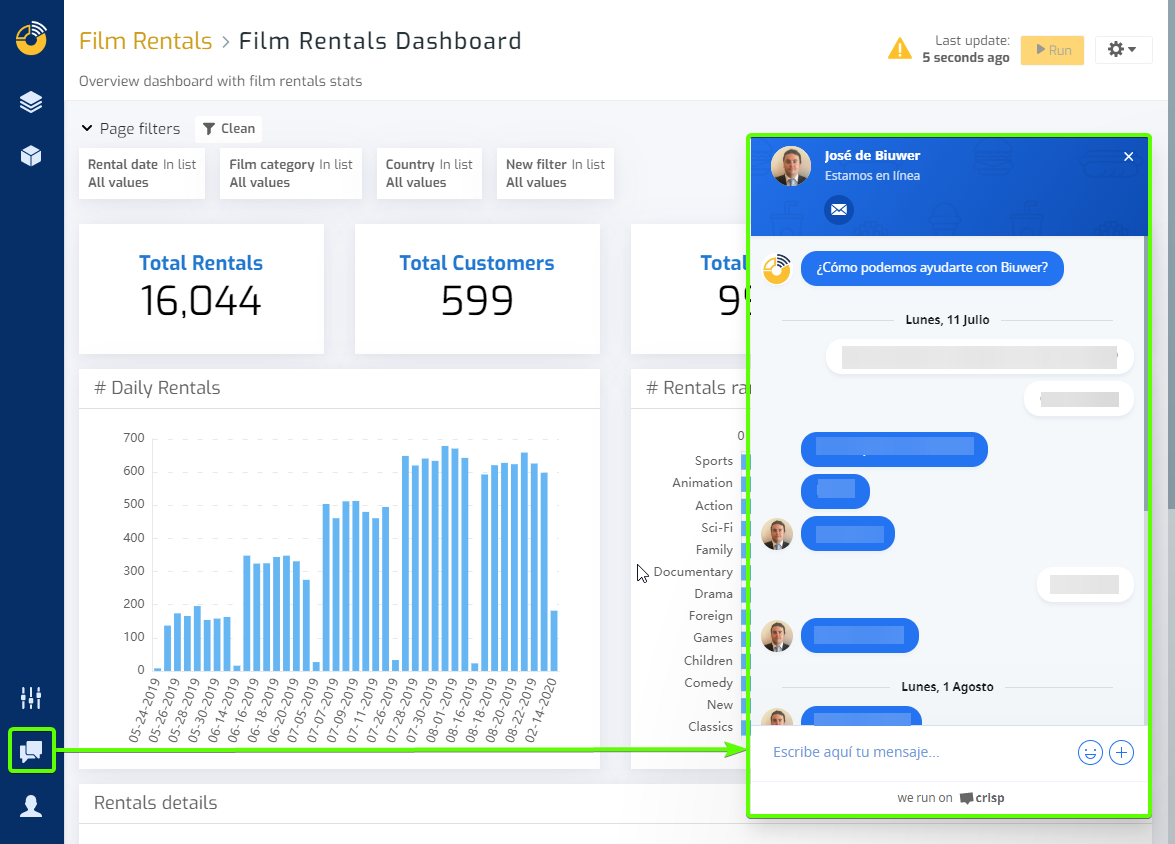
- Customer support system: We have modified the chat and customer support tool to allow better interaction and communication. This allows our team to assist users in the use of Biuwer and solve any problems that may arise.
- Managed data sets: The functionality to create and manage calculated fields in the datasets managed by Biuwer (data coming from APIs, cloud tools, files, etc. that are not in a database) has been included.
Bug fixes:
- Holded connection: Fixed an error when obtaining sales quotation type documents (estimates).
- Google Sheets connection: In the absence of information in a cell marked as a number, the value 0 was loaded. This is not quite correct in some cases, so from now on the cell value is treated as NULL.
- Other minor fixes.
June 2022
New functionalities:
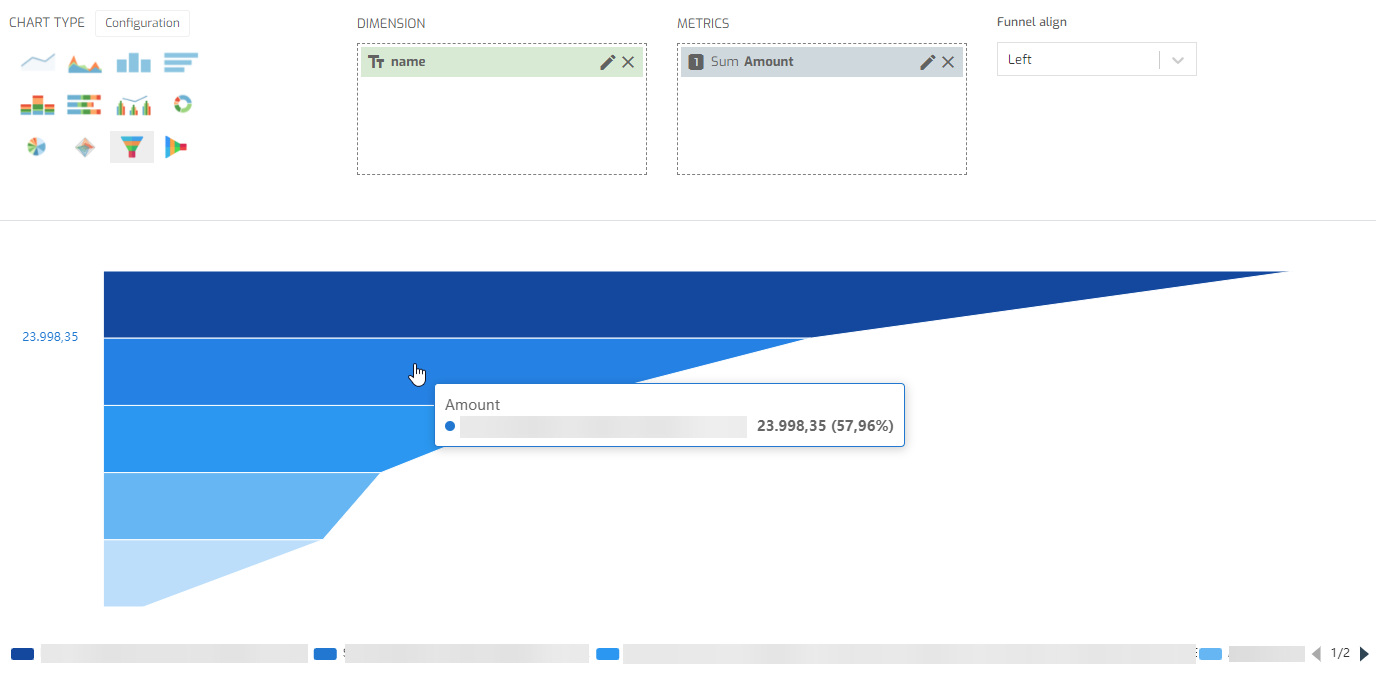
- New chart type “Funnel”. This type of chart can be very useful to visualize the performance achieved in multi step processes. For example, you can visualize your marketing campaigns performance, seeing the evolution of users along their journey, from first visit to purchase or other types of conversions.
-
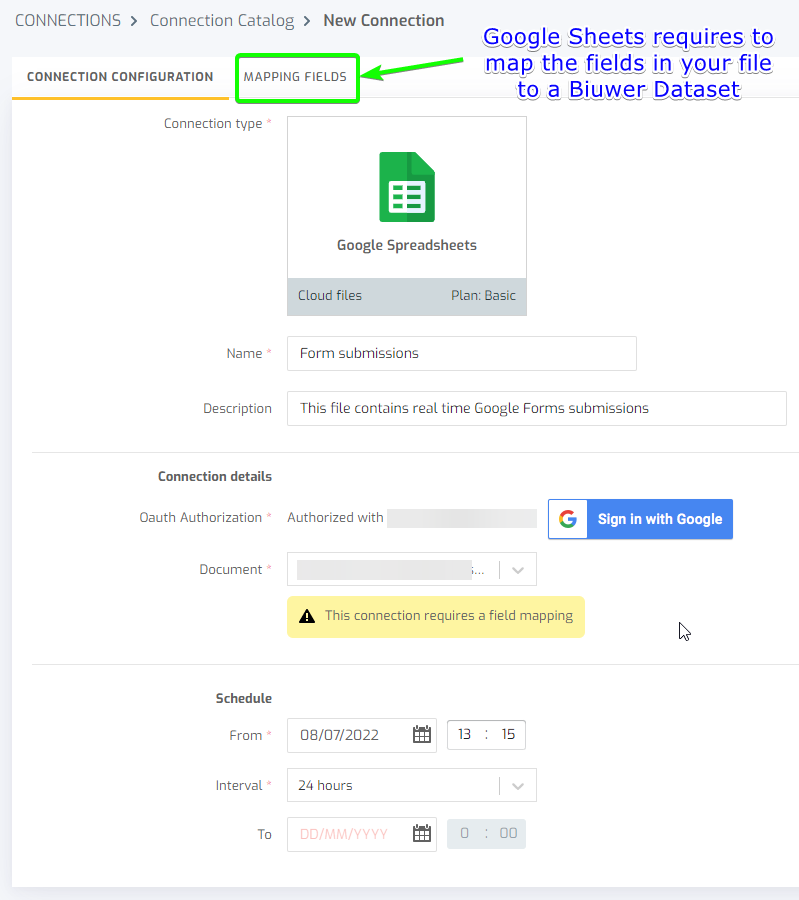
New connector “Google Sheets”. Now you can create a connection in Biuwer that automatically synchronizes the data contained in any Google Spreadsheet. As other similar connections, data will be automatically updated with the periodicity you set up. For example, if you use Google Forms to obtain feedback or any other information, the data will be kept in a Google Sheet, that you can analyze in Biuwer platform with the rest of your data.
-
Comparisons of data with previous periods. We have included in the Card Editor new functions that you can use in Calculated Fields to easily compare data with previous periods. This feature enables you to compare your data against past periods, such as, the previous day, the previous week, the previous month, the previous quarter and the previous year. See how it works in Comparisons with previous periods in Biuwer Docs.
Improvements:
-
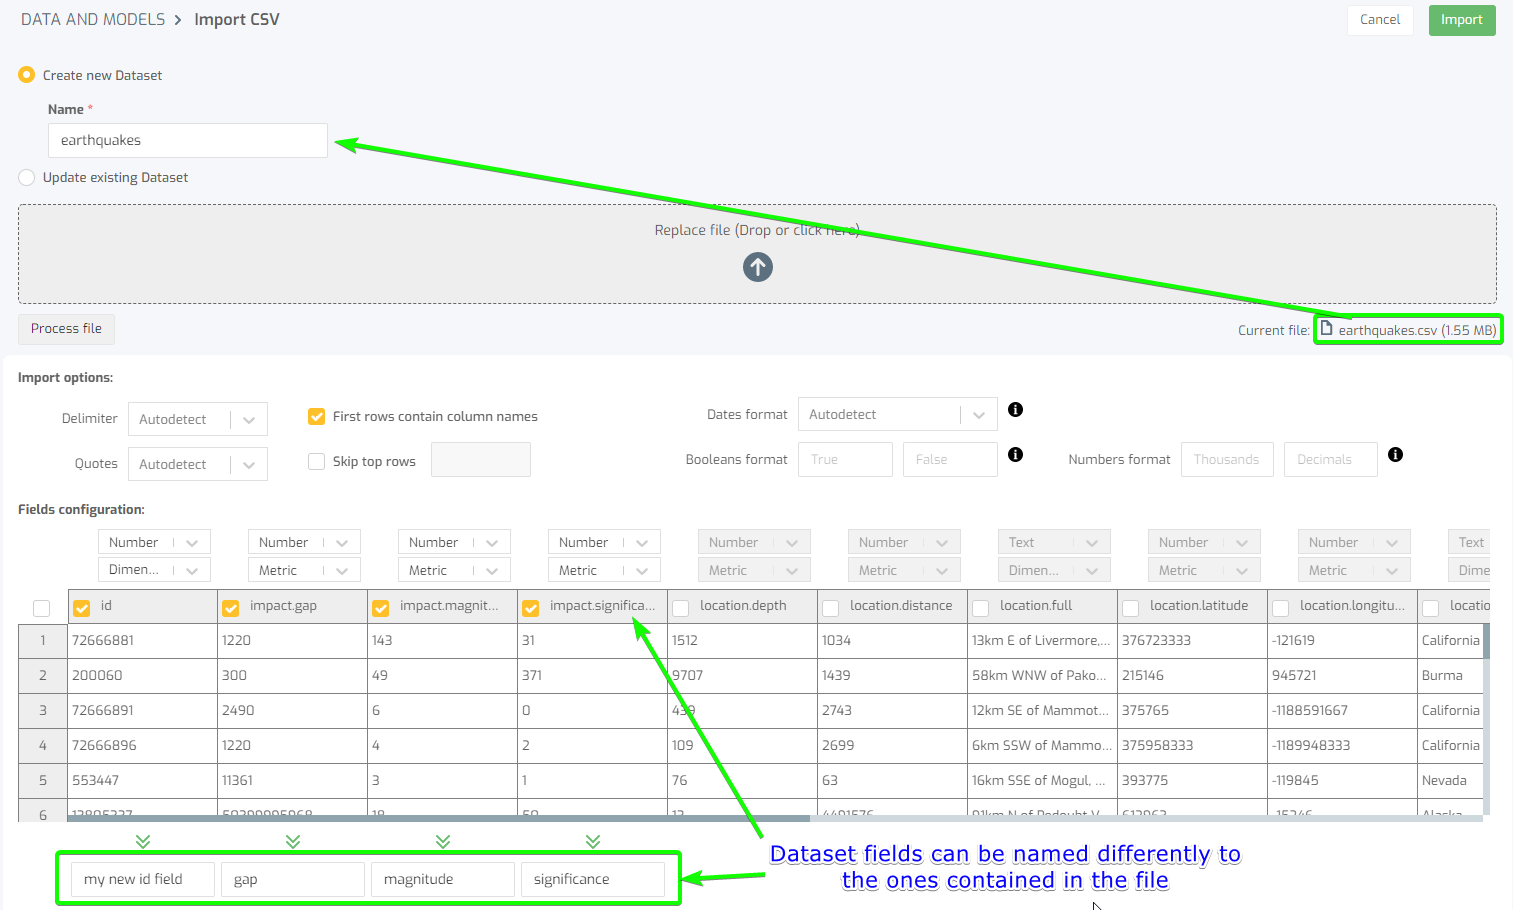
Files importer. We have included several improvements to make it even easier the management of importing data contained in files (CSVs, Excels).
- Now you can name the new dataset as you want from the import page. The default name is automatically the name of the file you upload to Biuwer
- The field mapping has also been improved. You must provide a valid name for each field mapped and it’s easier to create new fields or select previously created ones.
-
Application type data connections. Now you can delete your data connections of type application, which will also safely delete the data stored in Biuwer Data Warehouse and the processes that automatically retrieve and synchronize your data. This applies for example to connections like Hubspot CRM, Google Analytics, Holded, Google Sheets and so on.
Bug fixes:
- Minor fixes.
May 2022
New functionalities:
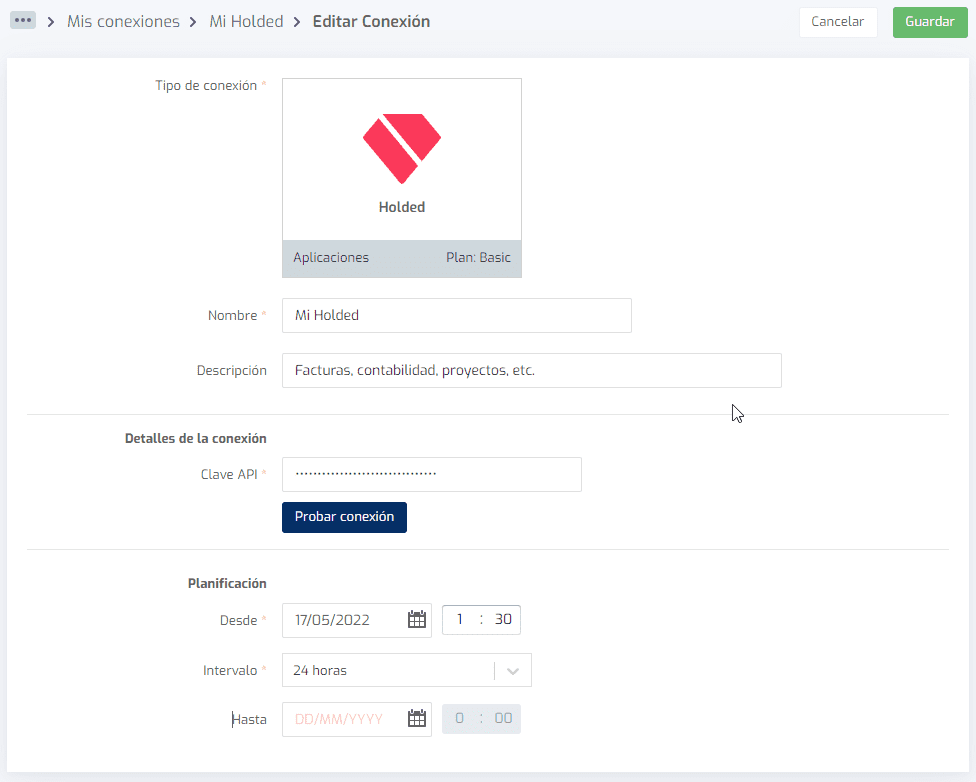
- New "Holded" connection. Holded is a business management tool for SMEs in the cloud with which you can manage aspects of your company such as billing, accounting, projects or human resources. With this connector in Biuwer you will be able to analyze all the information generated by Holded and perform a unified analysis with other data sources (applications, databases, files, etc.).
Improvements:
- Query engine: improvements have been introduced that allow the use of calculated fields defined in Datasets, in page and card filters. These calculated fields can also be used in the relationships between Datasets in Data Models.
- Filters: improvements have been included in the Dates filters, to allow the use of more original formats according to the database, in particular, to use formats with hours, minutes and seconds.
- Card Editor: extra operators have been included for the defined calculated fields of type Date. For example, the Date and Time level can be used for calculated fields, like any other physical field.
Bug fixes:
- Charts: Fixed a problem that caused some labels on chart axes were not displayed correctly in all cases, depending on the format (currency, symbols, etc.) applied.
- Charts: Fixed the problem that caused a chart with large tooltips to be reset, after having made selections of elements in the legend. This problem only occurred with tooltips with dozens of values displayed.
- Maps: Fixed the problem that occurred in symbol maps for data rows without any of the Latitude or Longitude values.
- Other minor fixes.
April 2022
New functionalities:
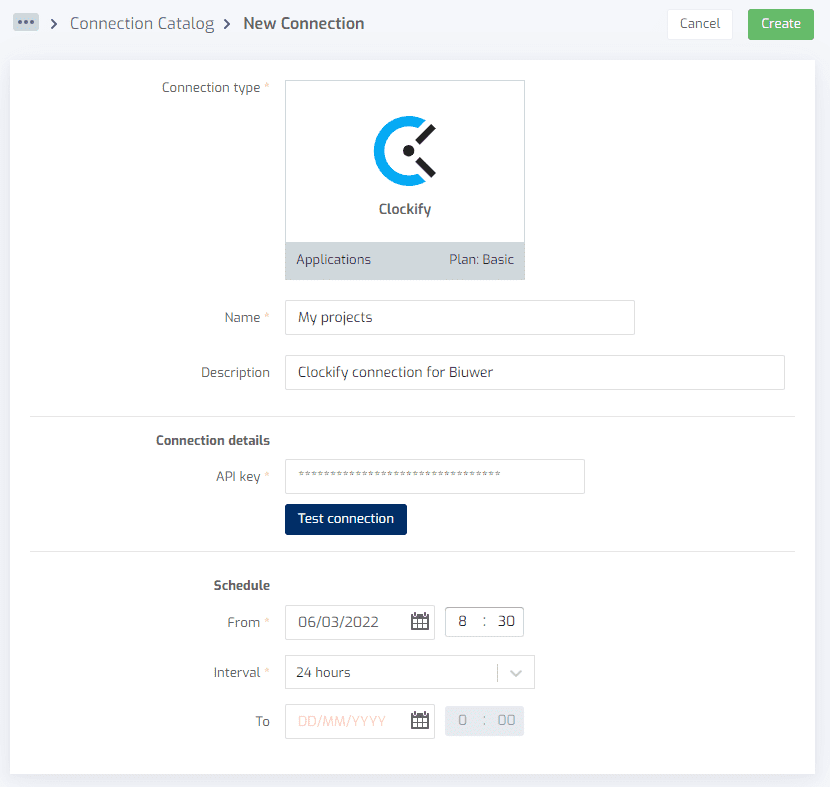
- New "Clockify" connection. Clockify is a project management tool with which you can manage for free your projects, tasks and time allocation, among other functionalities. With this connector in Biuwer you will be able to analyze all the information generated by Clockify and perform a unified analysis with other data sources (applications, databases, files, etc.).
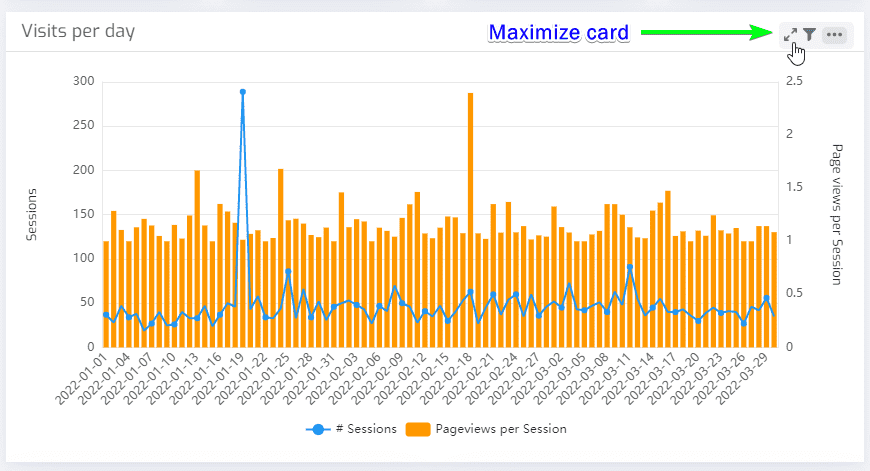
- Full screen cards. This functionality is very interesting to be able to visualize quickly and easily the information displayed by a card in full screen without having to leave a page. This way you can have more space to see in detail charts, maps, tables, etc. To maximize a card simply hover over the card and click on the maximize icon, which will display the card in full screen with the same information so that you do not lose the context.
Improvements:
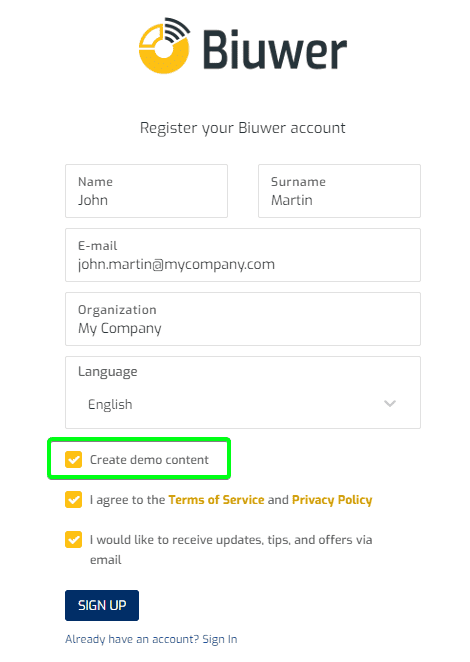
- Content Configuration. We used to always include a demo space with sample content for every new organization created in Biuwer. From now on, the main contact of an organization can choose to create this sample content at the time of registration.
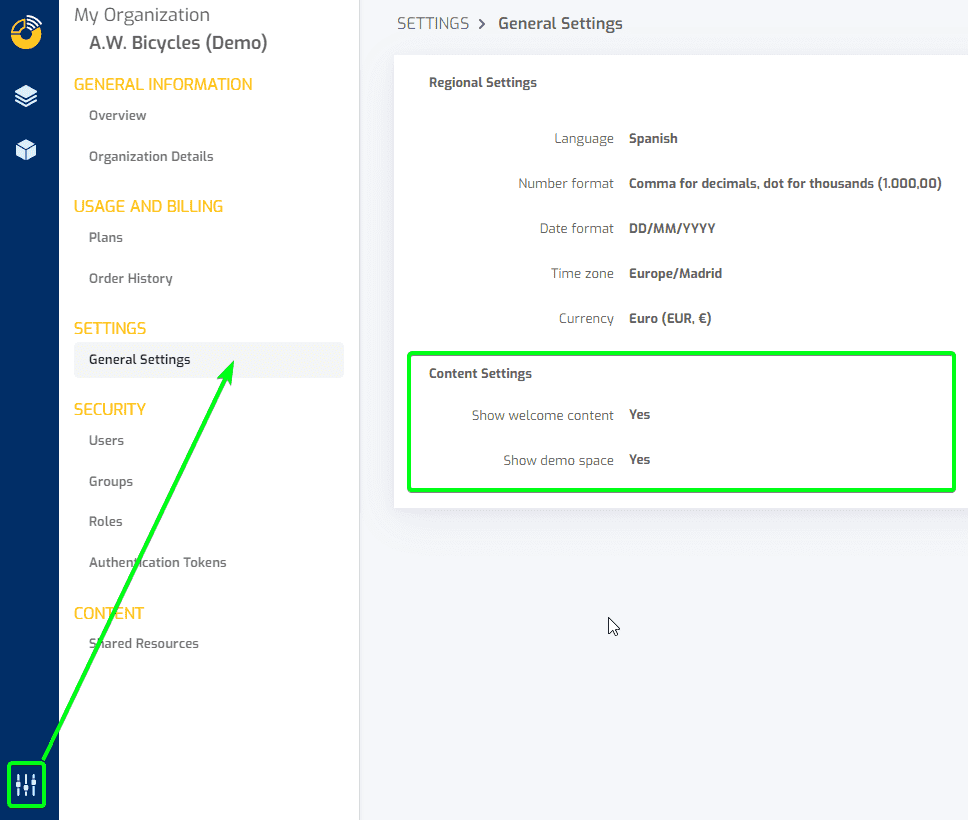
Later in the administration area, under Settings > General Settings, you can configure whether to display both welcome and demo content.
- Technology logo in the list of connections. We have included the technology logo in the list of your connections within the Data Center. This makes it easier to distinguish between them, especially when you have many connections.
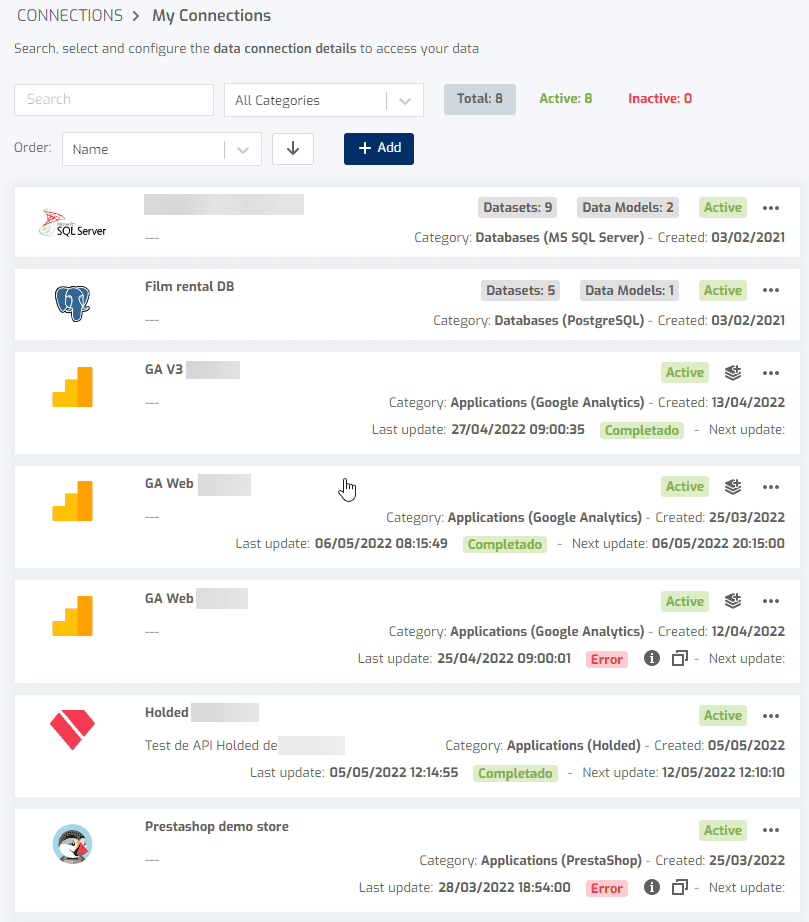
- Data update information for application type connections. Extra information has been included for API type connections to let you know when was the last data update, if it was successful or if an error occurred, and when the next update is scheduled.

Bug fixes:
- Interactive filtering in vertical tables. As you know there are many possibilities of data formats in Biuwer, including different formats for dates (including durations, formats in hours, etc), numeric values with currency, percentages, etc. We have improved the interactive filtering so that it works correctly in all cases in vertical table cards.
- Query engine. Improvements have been included in the query engine for those exceptional cases where object and field names contain spaces, dots and other special characters, so that queries are correct in all cases.
- Card editor. Cards with calculated card fields correctly display the data obtained by the query in the "Queries" tab.
- Other minor fixes.
March 2022
New functionalities:
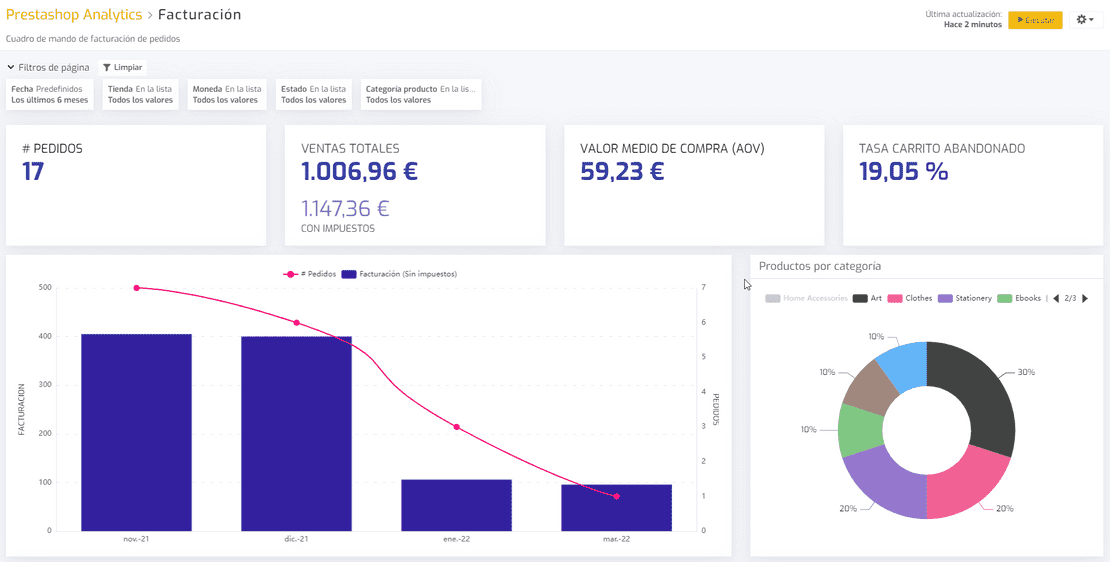
- New connection “Prestashop”. The connection to Prestashop, one of the world's leading e-commerce tools, is now available. With this connector, users can easily analyze all their online store data directly in Biuwer, with automatic data update according to the established schedule. We have many e-commerce related enhancements planned for the coming weeks.
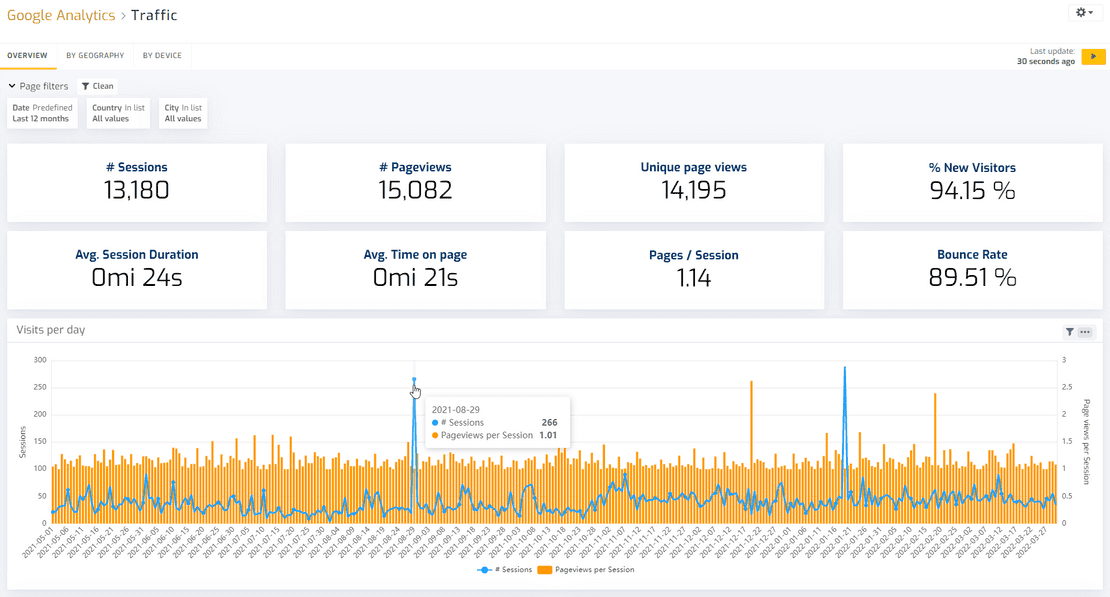
- New connection “Google Analytics” (Universal Analytics). The connection to Google Analytics, the world's most widely used web traffic tool, is now available. With this connector, users can easily analyze all their website data directly in Biuwer, with automatic data update according to the established schedule. You can also do a combined data analysis by merging with other data sources, such as your online store, databases, files, etc.
Improvements:
- Security system: several improvements have been included during the registration process, email notification system, trial period, identification of users and organizations, etc.
- Charts: Added date formatting in the legend and tooltips in Biuwer charts.
- Vertical tables: Added more style formats in the totals row, namely currency formatting, conditional formats, configured for the rest of the column, and time metric formatting when typed through a formula.
- Improved messages and graphics displayed in object listings when searching.
- Access to "My-space" is no longer done by the path "my-space" but by the space identifier.
Bug fixes:
- Card Editor: The list of pages in which the card being edited is included is now automatically updated in all cases.
- Card Editor: An error has been fixed when visually displaying the name of the card calculated fields. This problem was aesthetic, it did not affect the operation of the calculated field.
- Other minor fixes.
February 2022
New functionalities:
- New charting system. The new charting system includes much more versatile and informative interactive tooltips, which make it easier to compare values to draw conclusions.
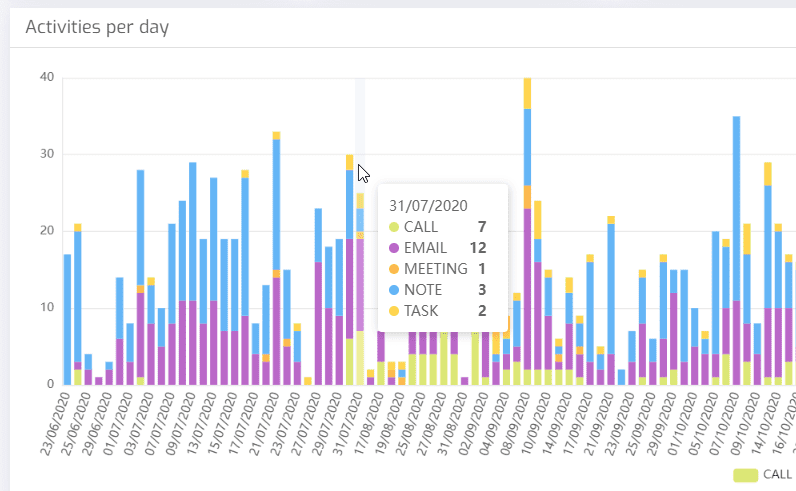
This is one of the recent major internal improvements in Biuwer, allowing us to include new chart types and advanced interactive functionalities with charts more easily. We are already working on funnel charts, which you will be able to use soon.
- Space search. In the new space navigation, a search engine has been added to speed up the work in organizations with dozens or hundreds of spaces.
- Conditional formatting using Boolean fields. You can now configure visual formats in cards according to the True / False value of Boolean fields.
Improvements:
- Biuwer changes color: It is a subtle change, but the application has been modernized by including indigo blue as the main color. You will be able to see it in the main navigation bar, buttons, dialogs, etc.
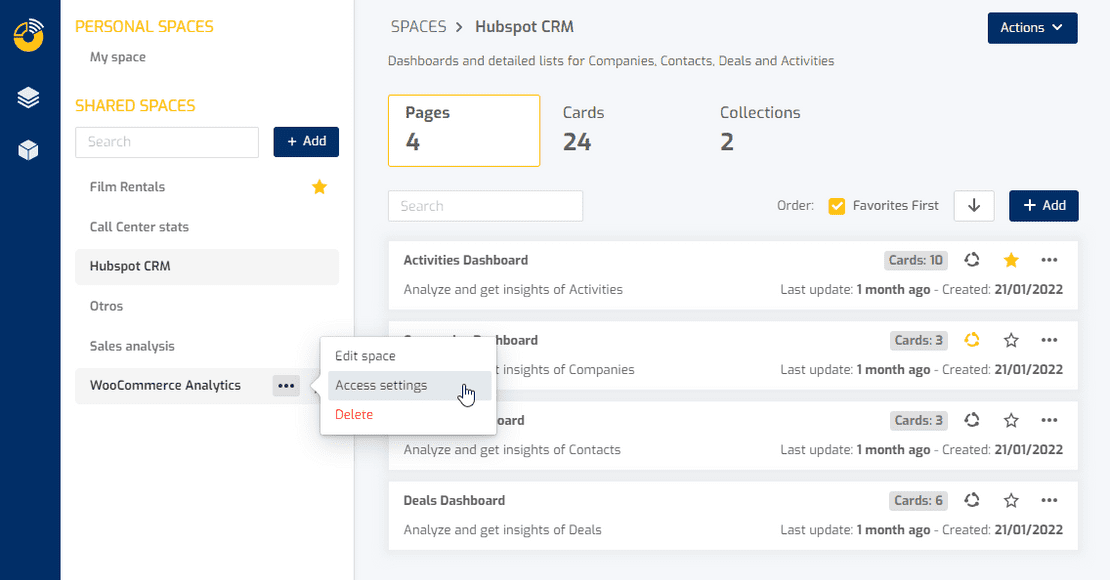
- The graphic design and usability aspects of the new content navigation system have been improved. Below you can see an example including the improvements introduced.
- Standard Users are renamed to Advanced Users. This is simply a nomenclature change to better reflect what advanced users are capable of doing versus basic users.
- We have unified the two types of User Groups available until now into one. From now on you can manage your users in groups, adding any type of users to them. Internally Biuwer will apply the maximum access levels and permissions depending on whether you are a basic user or an advanced user.
- Possibility to hide fields in Cross Table cards. Now users can configure whether to show each field when configuring the display in cross table cards.
Bug fixes:
- Charts: data labeling now works correctly in all chart types, thanks to the new chart system.
- Card Editor: an occasional problem has been fixed when applying a custom sorting of values.
- Filters: a bug has been fixed when configuring TOP filters, which are an advanced type of filter that allows to get the Top/Bottom/Interval values that meet certain criteria.
- Other minor fixes.
January 2022
New functionalities:
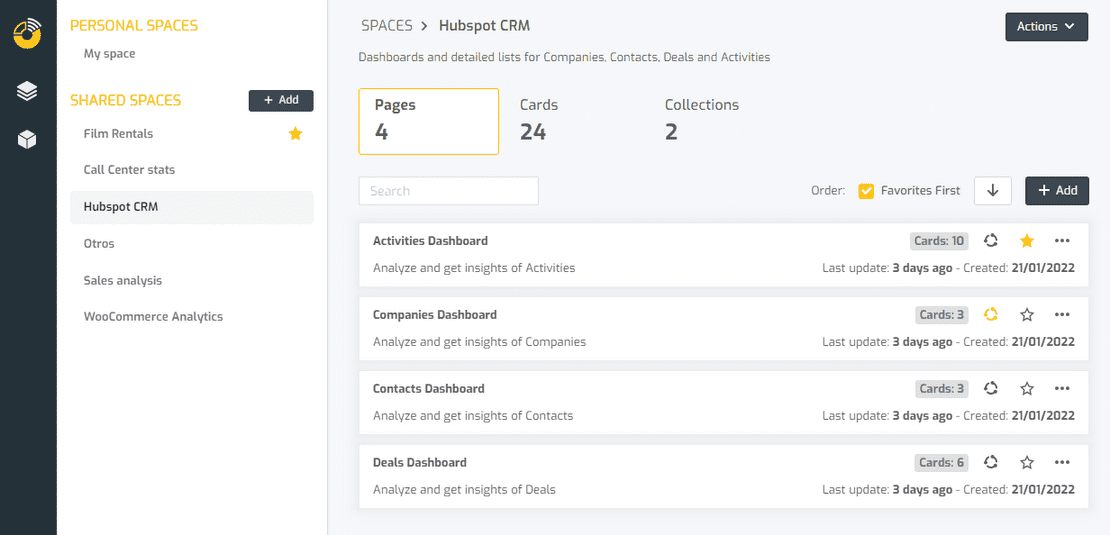
- New navigation system for content: We’ve included a new navigation for Spaces, Pages, Cards and Collections, with the objective of being even easier to access data and navigate through content. We. We look forward to your feedback and improvements!
Improvements:
- We’ve included the warning icon showing the "Row limit reached" in the Card Editor and the Card view screen.
- The top right menu under Pages is displayed for all users, including use with Embedded Analytics.
Bug fixes:
- Card Filters: Fixed an issue that did not display card filters on pages.
- Some tweaks have been made to the new Space navigation.
- Other minor fixes.
December 2021
New functionalities:
- Time zone in the query engine: From now on, Biuwer users can configure when to take into account time zones to display data at the hour level correctly. This functionality is especially relevant when analyzing different data systems, which generate data with different time zones and especially affects users geographically located in different time zones.

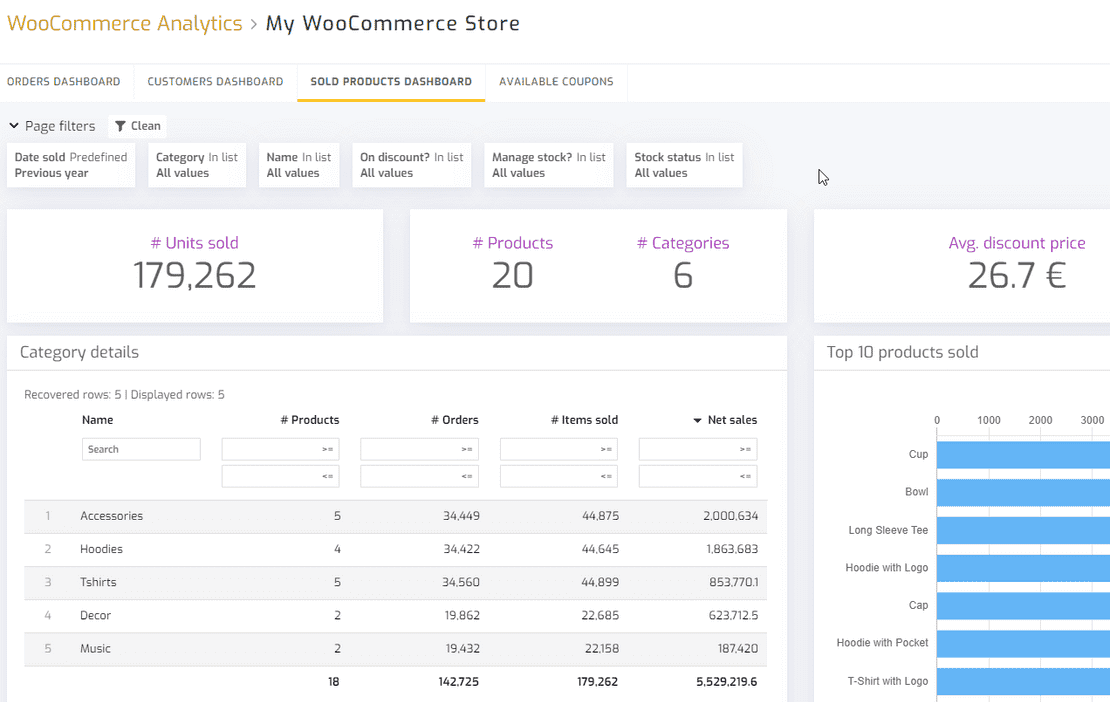
- New “WooCommerce” connection. The connection to WooCommerce, the electronic commerce tool of Wordpress, the most used content manager for websites in the world, is now available. With this connector, users can easily analyze all the data of their online store directly in Biuwer, with automatic updating of data according to the established schedule. We have many improvements related to e-commerce planned in the coming weeks.
Improvements:
- Cross Table Cards: The aggregation option is included in the cross table totals, so that the user can choose between an operation (sum, average, count, different count, maximum or minimum) or specify a formula.
- Time of Day (HH) level for Date type fields. Users can now analyze the data produced at certain times of the day and also filter by specific hours of the day. These types of analysis are useful when we have information on daily activity produced at specific times and we either want to filter by certain time bands and/or show the activities produced at certain times. For example, visits produced at 6 p.m.
- Data Center: A check has been implemented when removing Data Sets from Data Models, so now, if there are dependencies, the user will be shown which Cards and Filters use the Data Set that they want to remove from the Model.
- Authentication and authorization: The login mechanisms have been improved, as well as the maintenance of the active session, so that you can continue working with Biuwer minimizing the number of times you have to identify yourself.
Bug fixes:
- Minor fixes.
November 2021
New functionalities:
- New “Hubspot CRM” connection. The connection to Hubspot CRM is now available, users can connect their accounts of this popular CRM to automate data collection and analysis in Biuwer.
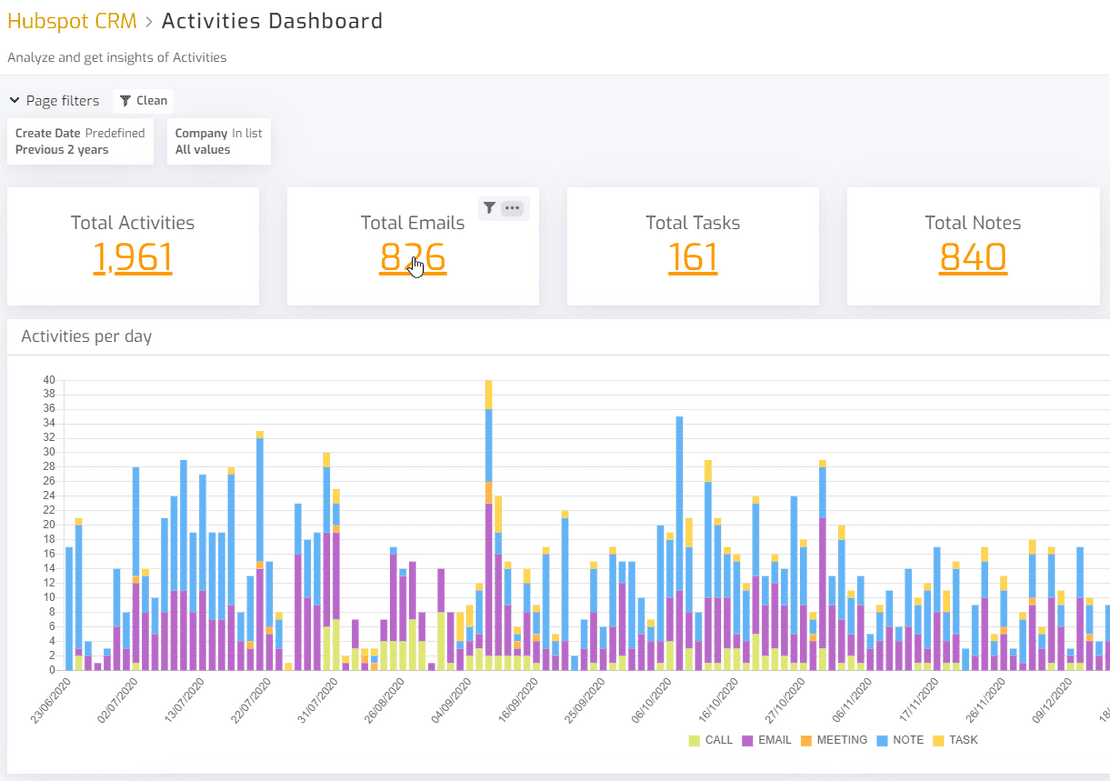
- Embedded analytics: Users can now export a full page as a PDF document when using the “Share” externally option. This can be done by accessing the page directly through the generated URL or embedded in third-party applications using the available methods.
Improvements:
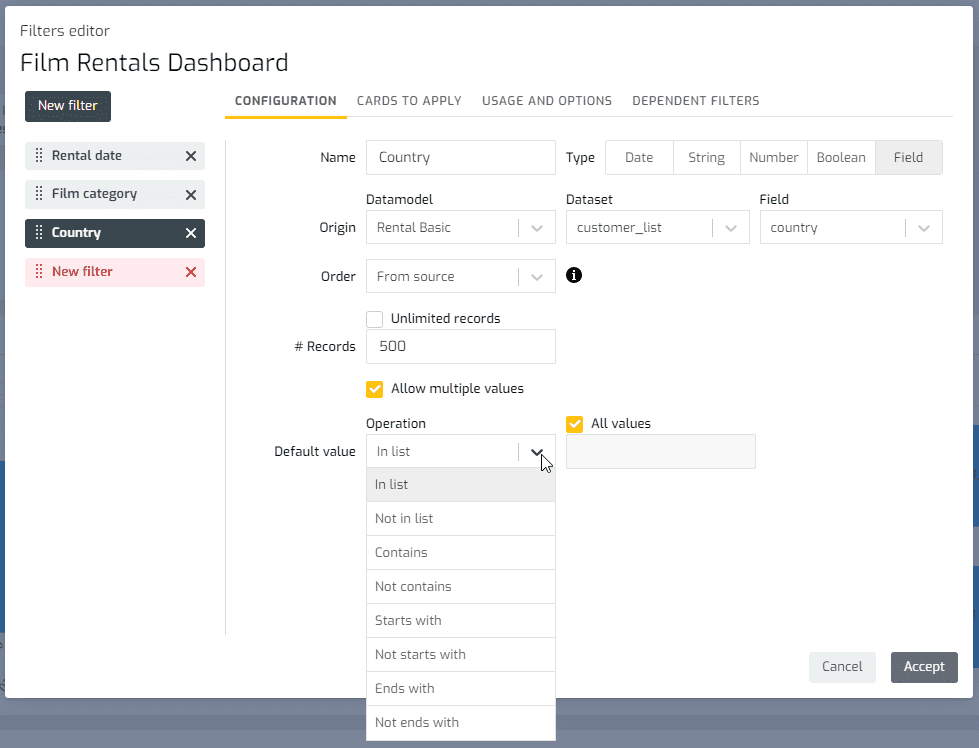
- Filter System: An update and improvement has been made to the filter editor and the filter usage dialog. In addition to design changes, the internal operation is faster, allows more records and better customization, especially the Date, Text and Number type filters, along with the formats applied to dates and numbers.
- Content System: During the last months we have been working on the internal improvement of Biuwer, including data management, the query engine, and the update of Collections, Pages and Cards.
- Orders: We have improved the order communication mechanism by email when they are automatically generated by Biuwer.
Bug fixes:
- Query Engine: Following the query engine update, incorrect inclusion of JOIN and WHERE clauses is immediately detected and corrected.
- Fixed a problem when changing the style of lines in axes of Chart type Cards.
- Other minor fixes.
September 2021
New functionalities:
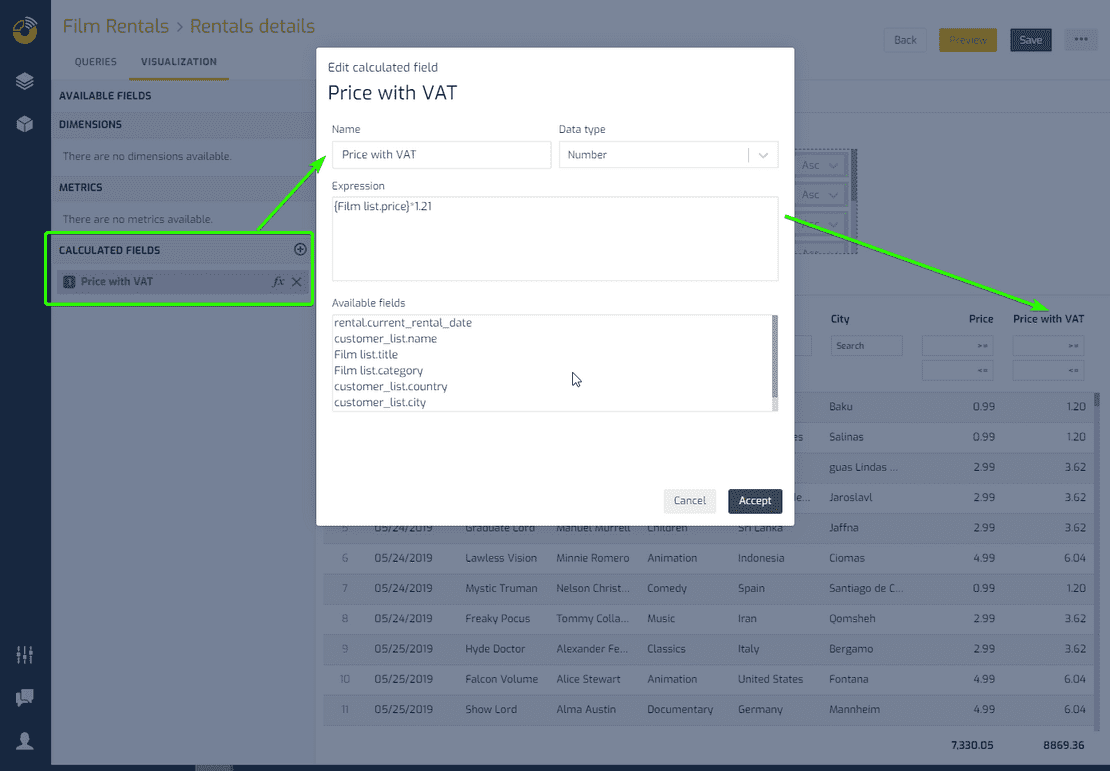
- Card Calculated Fields: In addition to calculated fields in Datasets, users can now define calculated fields on cards. This functionality allows you to perform calculations with the data once obtained from the different data sources used in the cards. The calculated fields behave visually like one more, and can have different formats.
- New pricing system: Pricing plans now include unlimited Basic Users (users to query data, known as read-only users) as well as unlimited content (Shared Spaces, Collections, Pages or Cards) and data. See updated pricing plans.
Improvements:
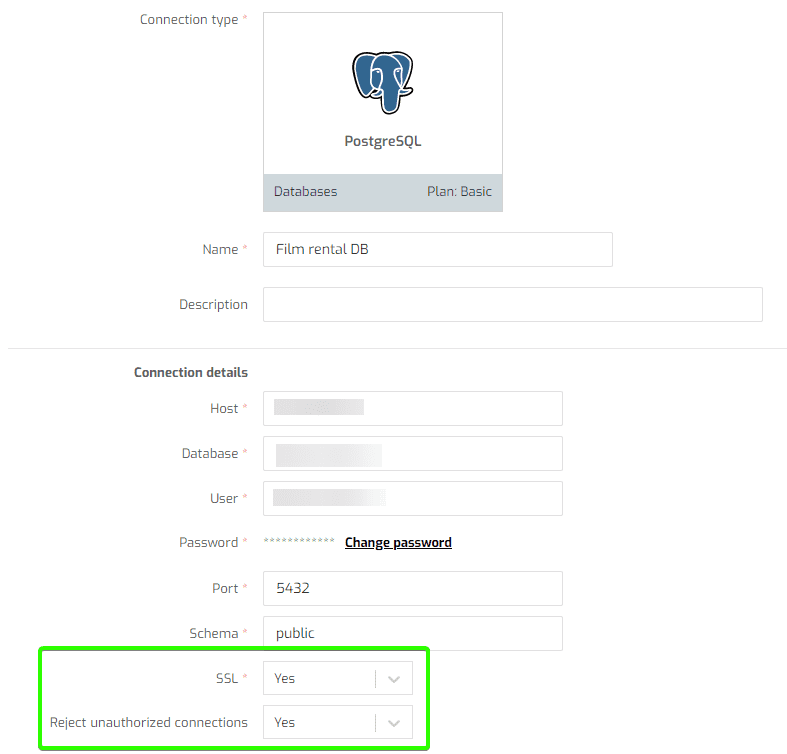
- PostgreSQL connection: These connections now include in their configuration the option to indicate whether SSL is used and whether unauthorized connections are rejected (using the PostgreSQL parameter “rejectUnauthorized”).
- Connection to Google BigQuery: The authentication mechanism has been updated and the performance of the query system has been improved.
- Oauth2 connections with Google: Due to the security and performance update announced by Google, it has been reviewed and confirmed that the length of the Oauth tokens in Biuwer by design, meet the requirements indicated by Google.
- Data Export: Duration formats are now included when exporting cards and pages. For example, if a duration metric is configured with the format HH:MI:SS, the same formats will be used when exporting, that is, 2h:32mi:15s.
- Data Export: New card calculated fields and their formats are also included when exporting data on cards and pages.
- Data Export: The order of exported data records is now guaranteed to match the order configured in the application just before exporting.
- Maps: tooltips support for multiple layers on different fields is included.
- Content Management: Improvements have been included when duplicating and moving Pages and Cards.
Bug fixes:
- Card Editor: Until now it was allowed to create a card with hardly any configuration, and this caused problems in some types of cards. The user is now required to configure the basic elements for each type of card (table, chart, map, etc.).
- Data Models: Until now it was allowed to change the type of data models between Managed and Unmanaged, and vice versa, which led to not finding the appropriate Data Sets in each case. From now on a Data Model already created is not allowed to change the type.
- Query engine (MongoDB): Fixed the problem that did not obtain data when a query was performed with a Lookup in MongoDB (in other databases it corresponds to a JOIN clause) including aggregation functions.
- Other minor fixes.
June 2021
New functionalities:
- New query engine: The query engine in the Biuwer client application has been redesigned, improving the performance of the application. This new approach allows much better management of aspects such as the data cache or the visualization of data in real time (real time analytics).
- Order cancellation: Sometimes a Biuwer customer may need to cancel an order for some reason, such as a change in the payment method. It is now possible to cancel an order in Biuwer and be able to place a new one with the desired characteristics of the chosen Biuwer plan.
Improvements:
- Administration area - User account activation: An improvement has been added that allows activating new users invited to your organization immediately, without the need to confirm the invitation by the end user.
- User deletion system: Now, when an administrator deletes a user the contents of his personal space will be copied to the personal space of the new chosen owner.
- GDPR compliance: Adaptation to the GDPR regulations for the elimination of user accounts from the platform.
- Collections: A dependency control of elements added in collections is added. Thus, when these elements (pages or cards) are eliminated, a dialog appears that warns that it is included in a collection.
Bug fixes:
- Parameter filtering system: An issue that caused filtering using URL parameters to fail when clicking on “Clear” filters has been corrected.
- MongoDB type connection: An error has been corrected when executing queries on models from MongoDB type connections when there were Joins between collections.
- Collections: Fixed various issues related to Biuwer collections.
- Inheritance of access control permissions to collections.
- Synchronization of metadata between shared collections.
- Access configuration: Some problems detected in the access configuration dialogs are corrected
- Minor fixes.
May 2021
New functionalities:
- Collections: Did you miss tabs at Biuwer? Collections are a new type of content that allows you to use pages and cards in new and different ways. Initially, the horizontal tabs in the upper left part have been included as a default navigation method. In this way, collections become part of the internal and external sharable content resources in Biuwer.
- Shared Resource Management: A Shared Resources Panel is included in the administration area that shows all the resources (Pages, Cards or Collections) that are being shared, with direct access to their configuration. Visual elements are also included in the content listings to show users what resources are being shared.
- Data center - Duplicate a Connection: Now you can duplicate data connections with a click, to adjust their parameters more easily.
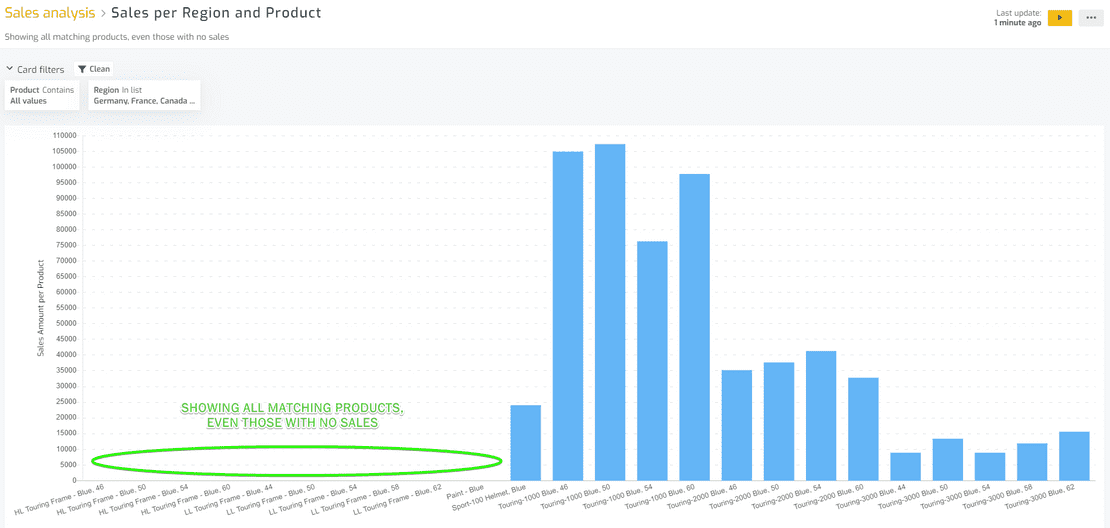
- Query engine - Show records without value: A typical use case can be to always display dates or other dimensions where no facts have occurred. This makes sense with OUTER JOINS applied to the query and with a filter configuration in which two or more entities are included, to show the records that have no value in all cases.
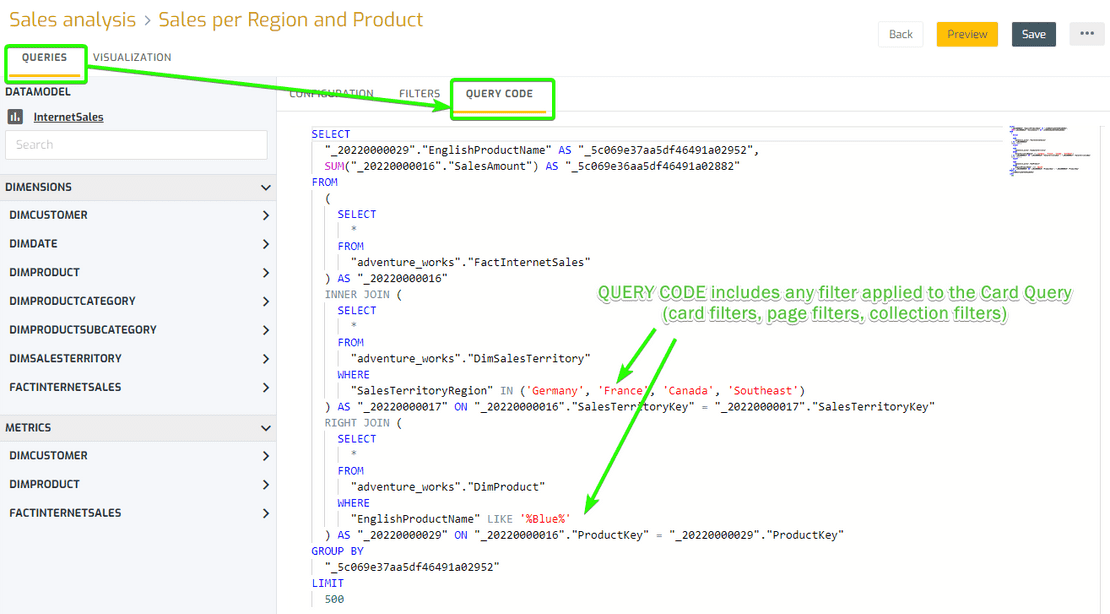
- Data Card Editor - Query Code: Users can now see the code that Biuwer's query engine runs on data sources, including SQL and MongoDB. This is useful to validate that the Data Models are correctly defined, since the query that each card performs can be displayed including all the configured options and any filter applied to it (card filters, page filters, collection filters).
Improvements:
- COUNT DISTINCT operation for MongoDB: from now on, users will be able to use this operator to count the distinct elements within a dataset physically stored in MongoDB.
- The role and permissions caching system has been improved, so that an update in the permissions can be applied immediately to the affected users. This is especially important when using Biuwer to give different users access to data in different ways.
- New possibilities of using Embedded Analytics, the version of Biuwer shared externally directly or in third applications, by allowing the use of the same Authentication Token simultaneously by several people. This enables information to be delivered at scale using Biuwer's data access security system.
Bug fixes:
- Reverse Engineering for MariaDB: we’ve fixed an issue that made this type of database not allow reverse engineering.
- Query engine for MongoDB: some cases not covered initially have been added to allow field filters on MongoDB collections to allow all included expressions.
- The card editor now synchronizes in all cases the levels of the date fields, between the query tab and the display tab.
- Visual improvements have been included so that the content is displayed correctly when the upper Notifications Area is active.
- Minor fixes.
April 2021
New functionalities:
- Dynamic connections: This new functionality allows you to dynamically create connections and apply them to data models. It allows to solve the problem that several Biuwer clients may have, which have connections to databases that have the same architecture at the data level but are installed in different databases..
You can configure a dynamic connection so that depending on a user or a group within Biuwer, one or another data connection is assigned. Thus, when that user or group accesses a panel, the connection that is configured in the data model, within the data center, will be dynamically selected.
Improvements:
- Data center - Supported data types: Support for the “Double precision” data type is added in the PostgreSQL database connection type.
- Contextual menu is added on each card that allows you to export your data.
Bug fixes:
- Embedding / Integrated Analytics: Fixed problem that caused it to not work correctly for certain types of cards.
- Minor fixes
March 2021
New functionalities:
- Dynamic filtering by parameters: A new configuration option has been added to the filtering system that allows applying the values of a filter by means of parameters sent via URL. The configuration of the parameters is customizable by the user and it is possible to assign a name to each of the parameters.
- New payment method - Credit card: A new payment method is added in Biuwer by which payments can be made through the online payment provider Stripe. The card payment system complies with the latest regulation on online payments PSD2.
- Biuwer Data Prep (Beta release): Biuwer Data Prep is added as an addon to include in the Biuwer subscription plan. Biuwer customers can now subscribe to the Beta version of Biuwer Data Prep in its first functional version.
- Authentication through private key with SSH connection: The option of being able to perform authentication with a private key when creating a connection through an SSH tunnel is added.
- A new chat customer support system is added.
Improvements:
- Administration zone:
- A section is added for the management and listing of the orders made by each account in Biuwer.
- Default configuration options are added for the account language, numeric and date formats.
- Navigation system: Titles are added for each page in the HTML page header replacing the generic title. In this way, the navigation of the application is improved.
- Card editor: From now on the configuration of the data format of the fields in the card editor takes the default format configured in its corresponding dataset.
- Cross table (pivot): The Count Distinct type aggregation option is added.
Bug fixes:
- Card export system: An error has been corrected in the card export system for date fields that causes the format not to be displayed in the date format defined in the card.
- Data center:
- Datasets: Fixed an issue where the values of the preview functionality would not be shown again when that dataset query returned an error.
- Calculated fields: Error when creating a calculated field with the SQL Server type connection has been corrected.
- Reverse engineering: A problem that causes reverse engineering to not work correctly is fixed,
- Data models: Fixed an error when saving the configuration of a data model that caused the relationships created in that model to be deleted at a certain moment.
- Vertical table card: Fixed an error in the indicator of the number of records obtained when a table filter is applied to.
- Card editor: An error in cards with multiple queries that prevented adding the same field in the different data queries has been corrected.
- Data filtering system: Fixed a problem that prevents filtering by field filters with a value equal to 0.
- Minor fixes
February 2021
New functionalities:
- Treatment of null values: New functionality by which Biuwer is able to show NULL values depending on the selected configuration.
For example, in a table of values we can indicate what to do with the fields that come with the null value, choosing not to show anything or to show a literal configurable by the user. Another example of this functionality can be given in a chart in which we choose what to do with the null values, for example assigning a 0 for each null value, thus ensuring that the chart does not have empty values.
Improvements:
- Maps: Added data type support for symbol maps whose Latitude and Longitude data type is text instead of a decimal number.
Bug fixes:
- Reverse Engineering: Fixed an issue in the reverse engineering utility that crashed when trying to apply to an existing dataset that had one or more calculated fields.
- Card editor: A data update issue is fixed for data cards whose query returns an error.
- Data Filters on pages: Fixed an issue where filters for a page are not applied when the data model for that page has been changed.
- Pivot tables: An error has been corrected when adding a formatted date field, such as the Year-month format.
- Maps: An error has been fixed when trying to create a page with more than one map card.
- Minor fixes
January 2021
New functionalities:
- Data filter system: A new functionality has been added that allows the same configuration to be applied to assigning a filter to all the cards on a page.
- KPI cards with traffic lights: A new functionality has been added to KPI cards that allows adding a visual element in the form of a traffic light.
Improvements:
- User Interface (UI): Improved the dynamic height adjustment of visuals elements in the administration zone and data center.
- Pricing plans: Improvement in the layout of the pricing plans page
- File importer: The User Interface is improved in such a way that the selection of destination fields and their configuration is now clearer.
- Configuration of payment data in orders: Updated the payment details for the payment method by bank transfer for customers in Spain.
- Updating of terms of use, privacy policy and cookie policy.
- Internal improvements in the Biuwer core and performance.
Bug fixes:
- Page structure: Fixed an issue that caused cards added to a page not to be displayed, causing the user to have to reload the page.
- Minor fixes
December 2020
New functionalities:
- Biuwer Maps: Added choropleth maps. From this version you can select symbol maps and choropleth maps. Biuwer users can create maps by regions or geographic areas adapted to each map using a set of available settings. Several types of maps styles are currently available, and custom maps can be added by contacting Biuwer user support.
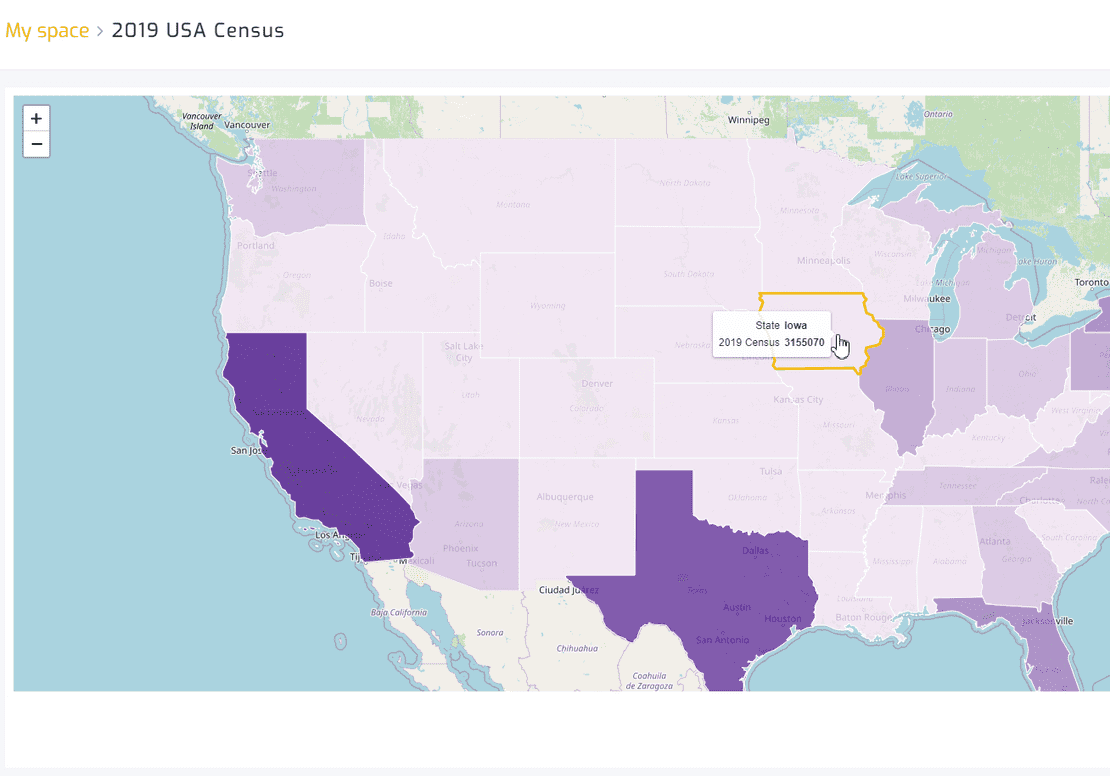
- Data filter system: New sort functionality is added in field type filters. Filter items can now be sorted in different ways (Source, Ascending, Descending, Custom Sort) and sorting by another field is also allowed.
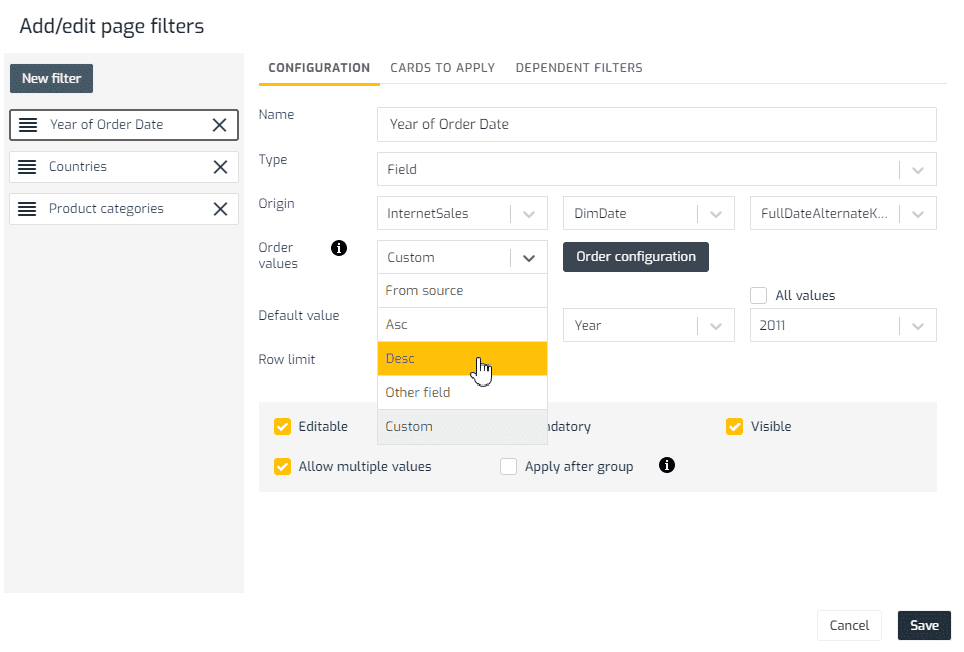
Improvements:
- Data filter system: The user interface of the filter assignment dialog to the cards of a page has been improved.
Bug fixes:
- Password reset email: Fixed a problem with the format of the email sent to the user.
- Biuwer Maps: Visualization errors are corrected in two styles of maps.
- Biuwer Maps: Error to represent fields of metric type in maps has been corrected. The aggregation function was not being applied correctly.
- Data filter system: A problem in the selection of values in the multiple selection type filters is corrected
- Vertical table: Fixed problem with interactive filters of date type
- Embedding: Fixed problem that denied access to shared visualizations with authentication tokens created more than a month old
- Data card editor: Fixed an issue with data synchronization for vertical table type cards.
- Tooltips: Fixed problem that caused certain tooltips to flicker.
- File importer: A problem is corrected when trying to add numerical data that caused it to not be parsed correctly.
- Minor fixes
November 2020
New functionalities:
- SSH Tunnel (Data Center): New functionality included of configuring a data connection through an SSH tunnel.
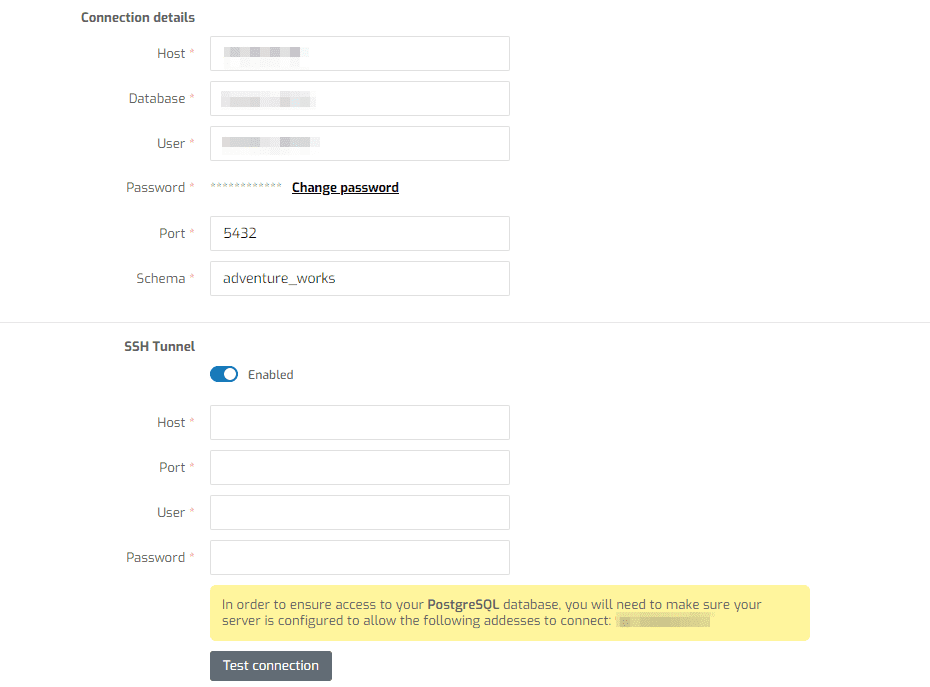
- Connections Catalog (Data Center): MariaDB, Google Cloud MySQL and Google Cloud PostgreSQL database connections are added.

Improvements:
- Datasets (Data center): A column with a check is added to see if the data policies have been enabled or not. This way you can see at a glance which datasets have data policies enabled.
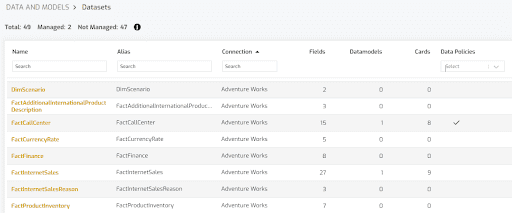
- File Importer (Data Center): Changes in the interface to improve the user experience.
- Access control: Improvements in the access control user interface.
- Performance improvements in metadata management
Bug fixes:
- Data card editor: Error messages in the data card editor do not appear correctly.
- Data filtering system: A problem in the user interface of the filtering system was corrected, whereby some values of selection inputs were not correctly synchronized.
- Fixed problem in the initialization of the central Biuwer server.
- Auto-query: Data synchronization problem is corrected when a page or dashboard has the option of auto-query data activated.
- Data Center: Fixed an issue in previewing data for a managed datasets. This happened when data was imported from excel or csv files and the data types of the dataset change.
- Fixed problem accessing a duplicate card when you are duplicating a card,
- Navigation actions: Error when navigating between cards is corrected
- File Importer (Data Center): Fixed some problems related to data types synchronization in fields imported from excel files.
- PDF export: Some errors detected in the export of cards and pages in PDF format have been corrected
- Minor fixes
October 2020
New functionalities:
- Biuwer Maps: A new type of data card is added, the map card. With this type of card we can create visualizations of geographic data based on maps.
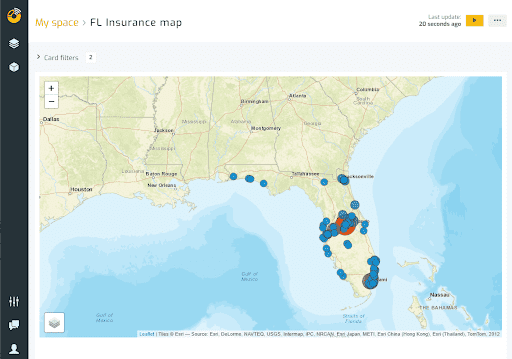
In this first version we can create symbol maps by assigning datasets to geographic positions using latitude and longitude. Up to 10 different map types can be selected within the map catalog that is incorporated into Biuwer.
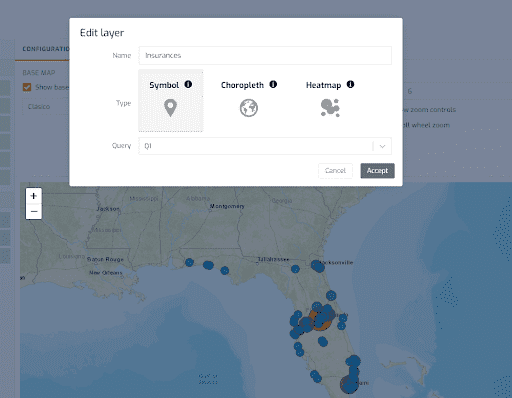
The setting of the map card is done within the data card editor in which a large number of options are incorporated to configure our data map.
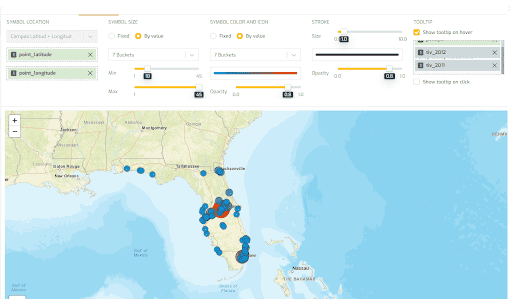
Improvements:
- Trial period: Improved the access control of organizations whose trial period has expired.
- Pages (User Interface): The message that appears when there is no access or when there are no pages (dashboards) to display is improved.
- My connections (Data Center): Improved the way in which we can modify the password for access to a data connection. Now passwords form inputs cannot be filled with third-party plugins such as Lastpass.
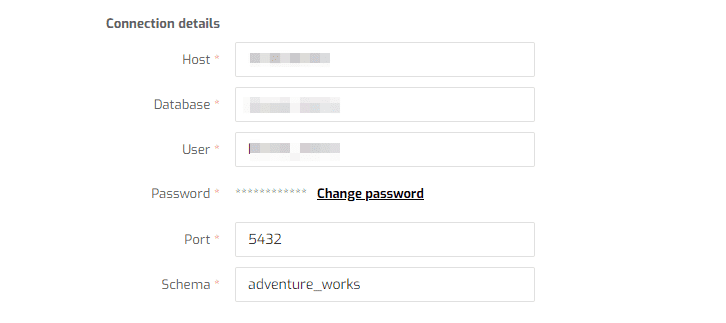
- Mejoras menores en la interfaz de usuario
Bug fixes:
- Acciones: Se corrige el problema que hace que no funcionen las acciones de navegación entre tarjetas y páginas. No se abre el diálogo de creación / edición de acciones.
- Datasets / Conjuntos de datos (Centro de datos):
- Se corrige error en el selector de tipo de campo cuando creas un nuevo campo dentro de un dataset.
- No es posible filtrar el listado de campos de un dataset
- Configuración de acceso (Seguridad): Se corrige un problema que hace que el diálogo de configuración de acceso no muestre los usuarios y grupos actuales.
- Espacio personal: Se corrige error que no muestra el botón de creación de páginas y tarjetas cuando se convierte un usuario básico a estándar.
- Correcciones menores
September 2020
New functionalities:
- Data Center: New categories of data connections are added, including cloud databases.
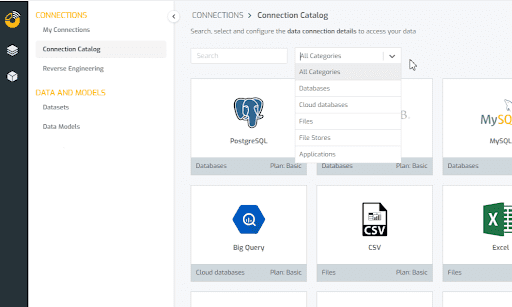
- Connection catalog (Data Center): Google Big Query cloud database connection is added
- Connection catalog (Data Center): Clickhouse database connection is added
- Connection catalog (Data Center): Oracle database connection is added
Improvements:
- Card export system: The table type card export system is improved. Now the export of date fields is done in the format that the card is displayed, instead of a fixed format.
- Data storage system (Biuwer Data Warehouse): The database technology used until now is changed.
- Connection catalog (Data Center): The notification system of connection to a data source is improved.
- Actions System: Fixed a problem that does not show the list of available fields in the external navigation action.
- Reverse Engineering (Data Center): Added an option to select or deselect all items
- Data card editor: Now the fields of the data cards with more than one data query will be identified by the query to which it belongs.
- Performance improvements
Bug fixes:
- Subscription system: Minor inconsistencies in subscription periods and payment method are corrected
- Data policies (Data Center): Fixed a problem in filtering numeric fields.
- File Importer (Data Center): Fixed an error that does not allow selecting cell ranges when trying to import data from an excel file.
- Security: Error when copying an authentication token to the clipboard
- Connection catalog (Data Center): Fixed an error in the filter of the connection list that made the filtering not working.
- Minor fixes
July 2020
New functionalities:
- Redesign of the signup process
- Administration zone:
- New order sections and order form (checkout).
- Generation of order sheet
- New section listing pricing plans
- New product section
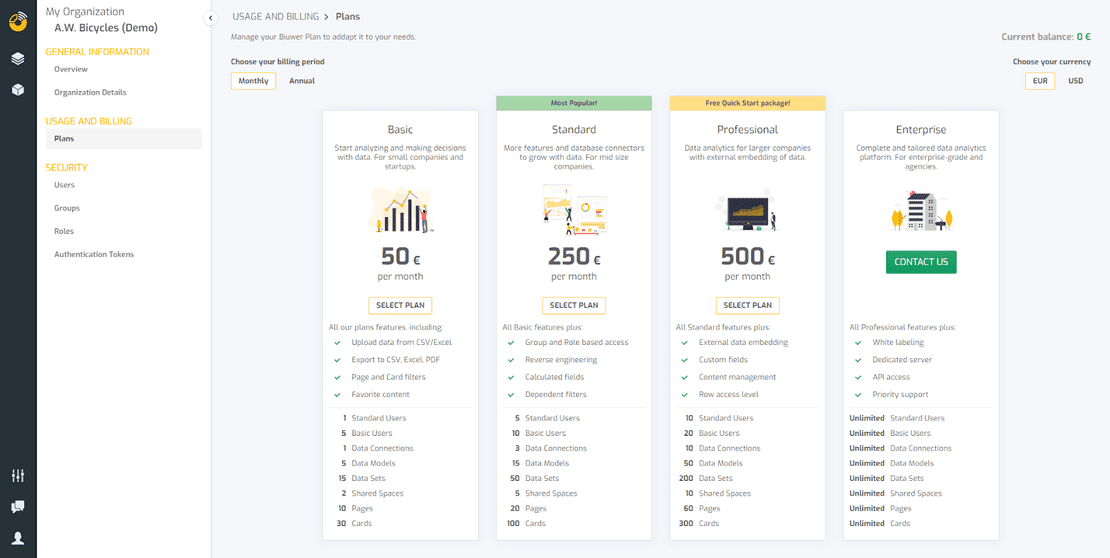
- Trial period: Biuwer trial period functionality is included by adding a message in the notification bar.
- New Data Center: The entire data center section has been redesigned, with a new side menu and including a new reverse engineering section design.
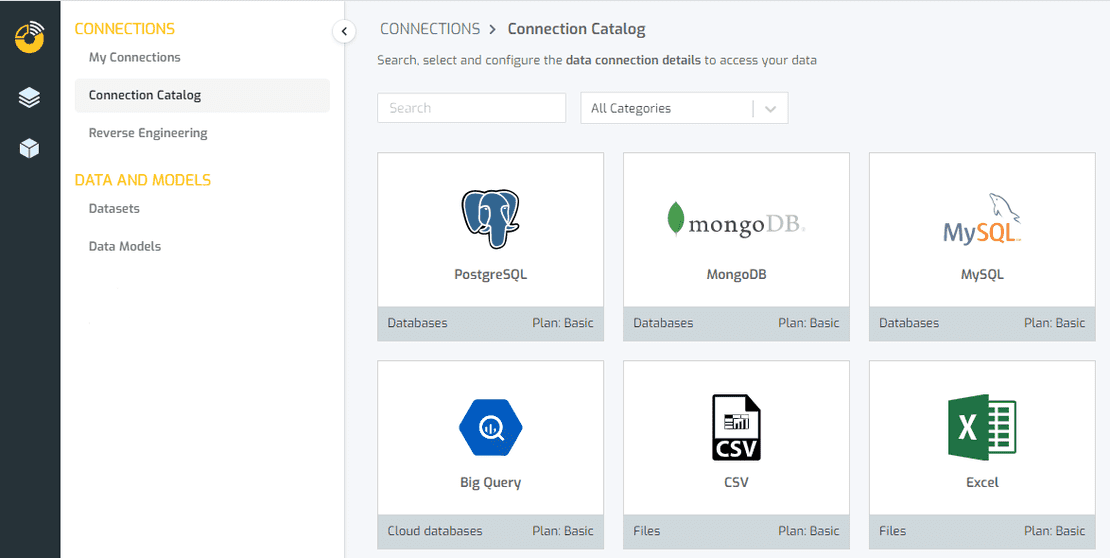
- Onboarding - New sample content: Now when you join Biuwer a data connection is automatically created with a workspace and sample data visualizations and dashboards.
Improvements:
- Administration zone: Verification of VAT numbers is added for the application of taxes at European and extra community level.
- File Importer (Data Center): The user interface of the data importer is improved. It’s now displayed on a page instead of a dialog.
- Reverse engineering (Data Center): Data types are included and a warning is added when unsupported data types are detected.
- Authentication system: Improvement of the authentication system using Oauth.
Bug fixes:
- Access control: Fixed a problem when assigning permissions to new user groups. Fixed a problem in checking access to an inactive organization.
- Administration zone: Fixed a desynchronization of the status of users pending validation, which have already been verified, in the user management panel.
- Data types: Fixed a problem with the "character" data type in PostgreSQL data source.
- Chart Data Cards: Fixed a critical issue in vertical bar graphics card settings.
- Fixed a problem with the access link of welcome emails sent by Biuwer.
- Minor fixes
May 2020
New functionalities:
- User authentication: New landing screen for validation of invitations to new users
Improvements:
- Administration zone: The performance of the client and server application is improved throughout the Biuwer administration zone.
Bug fixes:
- Data visualizations: Fixed bug in custom sort option.
- Administration zone:
- Fixed error in which the users last connection date was incorrectly displayed.
- Organization additional notes information does not accept multiple lines
- Fixed error when deleting a user that made it impossible to delete in certain situations.
- Workspaces: Fixed a bug in which “My space” was shown for basic users.
- Minor fixes
April 2020
Bug fixes:
- Security system using access tokens: The problem in the duration of the validity of the authentication token is corrected.
- User interface: Correction in the positioning of popovers within the data card editor.
- Embedding Analytics: Fixed problem that caused access denied for certain users when sharing a panel via link.
- Minor fixes
March 2020
New functionalities:
- New Administration Zone: The Biuwer Administration Zone has been completely redesigned. In the administration area, you can carry out the following:
- General information: Account management, subscription status and organization details.
- Use and billing: Information about the usage fees in Biuwer, selection of price plans, purchasing new products and billing history.
- Security: User management, user groups, roles and authentication tokens.
- New main menu bar: The side navigation menu has been redesigned. The menu is still in the left side area, leaving more free space as a work area. Now the menu is prepared for mobile devices, which makes it much more accessible for users who access Biuwer through smartphones and tablets.
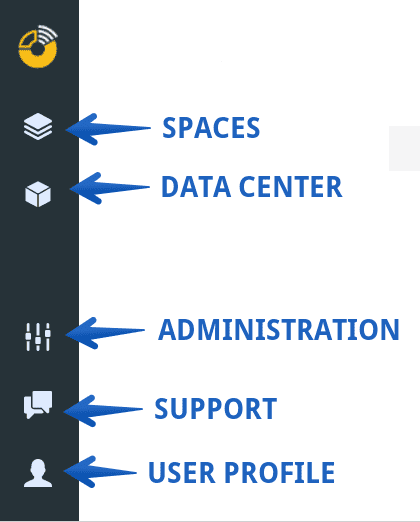
- Description in popup: Now when you add a description to a card, it will be seen in a popup when you hover over the information icon.
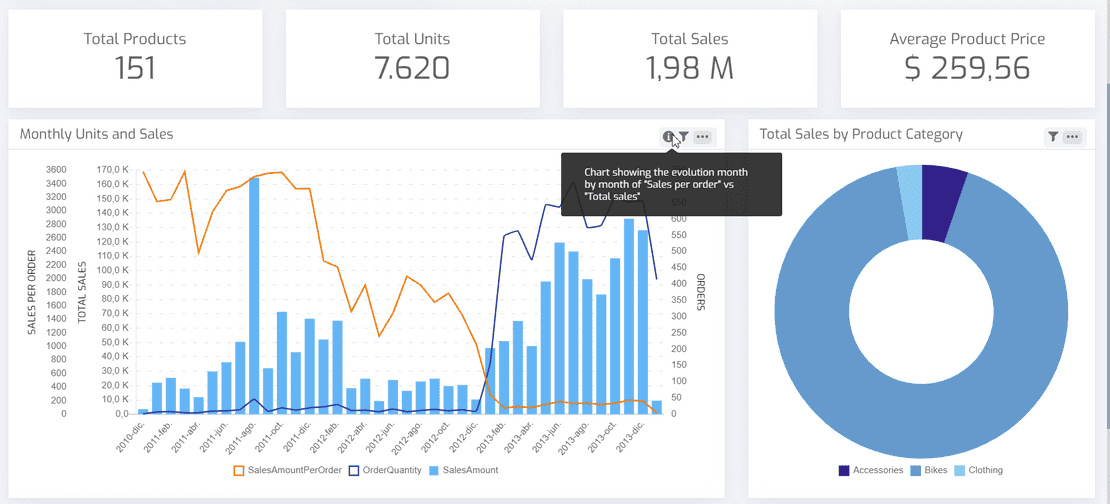
Improvements:
- Backend redesign and performance improvement: We have redesigned the way the client and server applications communicate, now using GraphQL together with Redux. This implies a great improvement in the performance of Biuwer and allows us to develop future functionalities much more efficiently in terms of performance and fluidity in the user interface.
- Improved performance in data caching: We have redesigned the in-memory data cache layer which improves access time in different areas of Biuwer.
- Improved option to move pages: The option to move pages has been improved by simplifying the way cards are copied or moved from within that page or panel.
- Improved password security: The password security mechanism has been improved. Now all default passwords have to meet a high level of security.
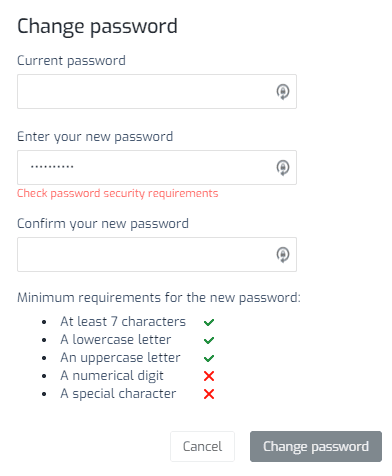
Bug fixes:
- Minor fixes
February 2020
New functionalities:
- Automatic execution on cards: Added the option “Auto apply filters” to execute the data query on a card when it is being viewed individually.
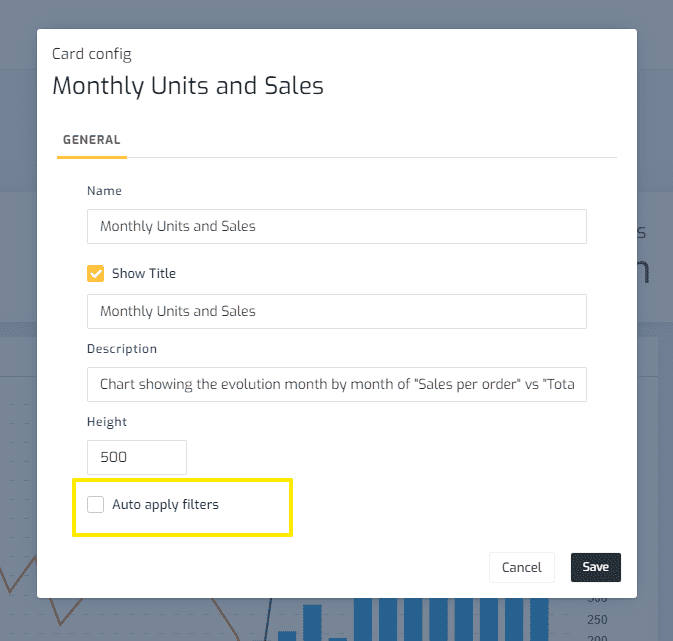
- Data visualizations - KPI cards: Added the functionality to create cards that support more than 4 indicators. Until now the maximum number of indicators was 4 per card. Now you can add as many indicators as needed in each area of the card.
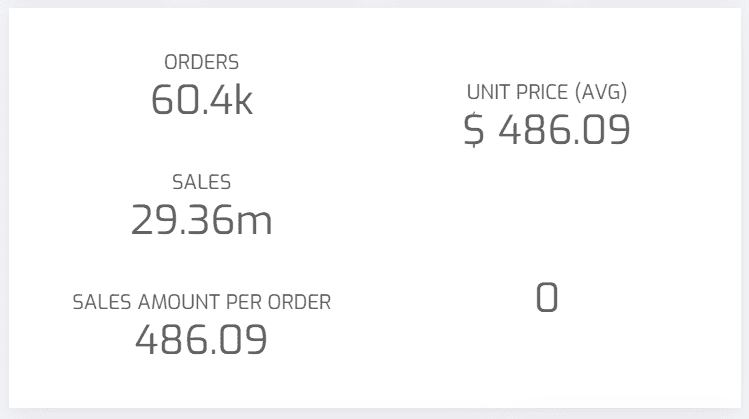
- Website: Pricing plans are added on the website.
- Website: A new blog section is created on the Biuwer website.
Bug fixes:
- Data visualizations - Vertical tables: Fixed a problem with the inclusion of a second vertical scroll bar that appears when the option to show the number of records obtained is activated.
- Data Visualizations - Vertical Tables: Fixed problem when using interactive value filtering on columns with date type fields and with empty values.
- Data Visualizations - KPI card: Fixed problem when applying conditional formats when the indicator has a value equal to zero.
- Data Card Editor: Fixed an issue when editing a card and changing the data model of the query causing the fields on the visualization tab not being cleared.
- Minor fixes
January 2020
Improvements:
- Share content: Width and height settings are added when sharing content externally by embedding system.
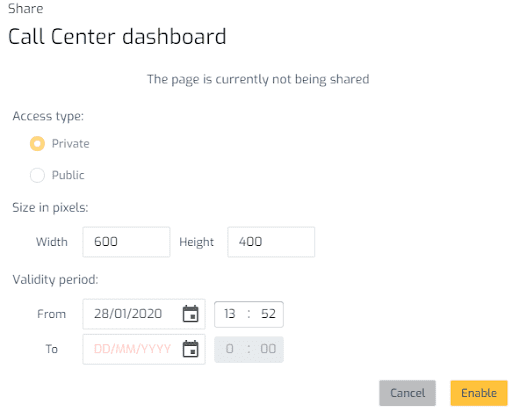
- User interface: Added new menu option of “Access Settings” to the contextual menus in cards (inside the pages). This way you can configure access to a card while you are viewing a page.
- Color palettes: Color palette options are extended. Now chart cards with more than 15 divisions will be displayed with different colors.
- Top, Bottom and Interval filters: Added support for this type of filters for MongoDB data sources.
Bug fixes:
- Personal space for basic users: Fixed a problem for basic users that makes the personal space screen accessible in certain cases. Basic users do not have personal space functionality activated.
- Data visualizations - Charts: Fixed problem in the color selection of stacked bar charts. When changing the division field the selected color is not displayed correctly.
- Interfaz de usuario: Fixed some styles in dialogues.
Biuwer 1.21
New functionalities:
- Basic Users vs Standard Users: A new type called basic user is created.
Basic users can only view and analyze data in Biuwer that has been previously shared with them. They do not have a personal space and cannot manage and edit content within Biuwer.
This type of user is much cheaper than a standard user and is ideal for those user profiles who only want to view the content
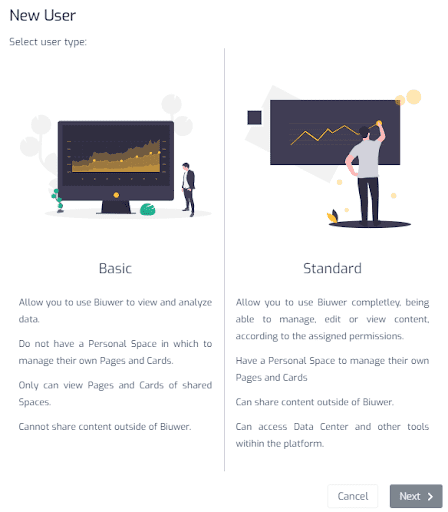
- Icons on indicator cards or KPIs: Icons are added to KPI type data visualizations.
![]()
![]()
Improvements:
- Actions: Biuwer session parameter is added to be able to use it in external navigation actions along with the URL. This allows external applications to validate the Biuwer session.
- Authentication tokens: Extra security layer is added to the authentication token system. Now the token system is even safer.
Bug fixes:
- Cross table: Fixed a problem in the horizontal alignment styles of the header.
- Duplicate objects: Fixed a bug when trying to duplicate pages or cards.
Biuwer 1.20
Bug fixes:
- Data Visualizations - Charts: Fixed a bug in the color picker of a stacked bar chart.
- Multi tenant system: Fixed a bug when adding a user to another account of another Biuwer organization.
- Data Center: Fixed an issue when trying to create a new connection. Sometimes the list of available integrations appears empty.
- Data export system: Fixed a bug in exporting data from a card in csv and xls format.
- Data export system: Fixed problem when exporting a card in PDF format. In vertical tables hidden columns are being exported as well.
- Data export system: Data export problem is corrected when browsing from an action from another page or card. The data that is exported is not correct.
- User interface: Layer depth problems with z-index are corrected in the card editor.
- Data filtering system: Fixed a problem with date filters. The filter is not applied when you try to filter by the last day of the month.
Biuwer 1.19
New functionalities:
- New system to share content: New functionality is added to share a page or card. The content can be shared in two ways: Through a link or through a script to embed or insert the content into an external application.
With the option of embedding content you can add your dashboards or individual cards in your own applications.
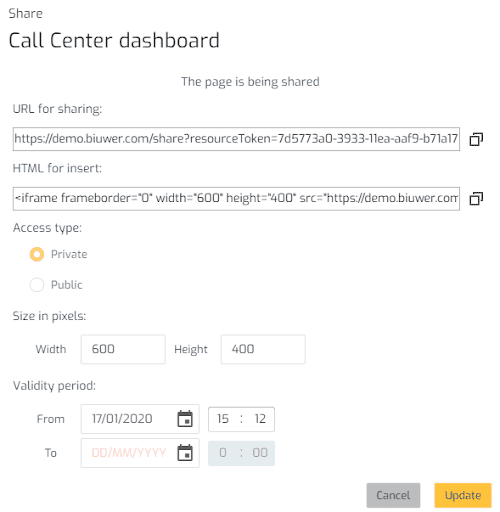
Bug fixes:
- Data filtering system: Fixed issue with dependent filters.
Biuwer 1.18
New functionalities:
- New authentication system using tokens: A new system is added to generate authentication tokens for a Biuwer user. Authentication tokens can be used in Biuwer to manage permissions with third-party applications or for example to authenticate embedded Biuwer content in external applications.
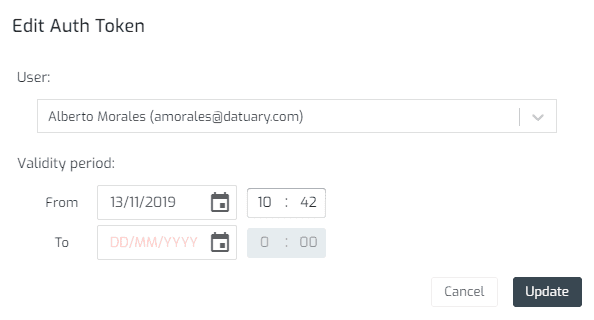
Improvements:
- Side menu for mobile versions: Now the side menu has a responsive design and adapts to all mobile devices.
Bug fixes:
- User interface: Problems with styles of overlapping elements in layers are corrected.
- BigQuery Connector: Fixed problem in addition to sums with very small results.
- Vertical table: Fixed an error in the interactive filter within a vertical table for numeric fields.
- Vertical table: Fixed error in the default sorting of vertical tables.
- User Interface: Color correction in the icons set.
Biuwer 1.17
New functionalities:
- New data source - PostgreSQL: A new data source has been added to connect and analyze data from one of the most used databases in the world, PostgreSQL.
Improvements:
- Action system: Added navigation actions to cross tables.
Bug fixes:
- Chart sorting: Fixed an issue with dimension sorting in chart cards.
- Filtering system: Fixed an issue when applying page filters to the detail view of a card.
- Minor fixes.
Biuwer 1.16
New functionalities:
- New action system: New functionality that allows you to create actions in the data cards. There are three action types: navigate to card, navigate to page and navigate to an external URL.
Navigation actions allows you to navigate to a destination (card, page or external URL) by clicking the elements of a card. For instance, in a KPI card, you can click in the indicator value and navigate to another card where you can see the detail of that indicator.
Actions are also available in other visualizations types, for example in vertical data tables.
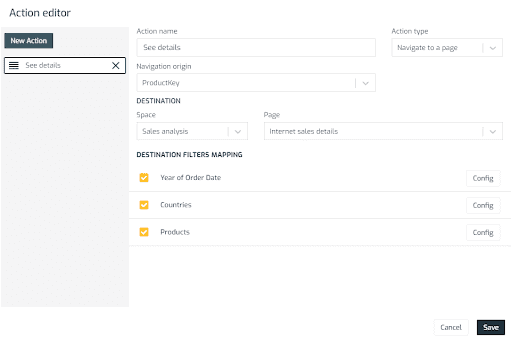
Bug fixes:
- Minor bug fixes.
Biuwer 1.15
New functionalities:
- Custom fields: New functionality that allows you to add custom fields. These fields can be assigned to users and groups. Using custom fields, you can apply data policies to apply a security layer to datasets. For example, if we create a new field called “employee_code” we can assign a value to each user and apply data policies through this field, in this way we can filter the access to the data of a dashboard by filtering it through this new field.
Improvements:
-
Administration zone: Added new column in the users list with the last login date.
-
Visualization - Vertical tables: Added an option to hide columns in vertical tables.
Bug fixes:
- Fixed an issue that causes the user to log out and have to login again.
Biuwer 1.14
New functionalities:
- Automatic redirection: From now on, if you access Biuwer through an URL content, it will ask you for login and then you will be redirected to the specified URL.
- New sorting system: More sorting options are added in the data visualizations. Fields can now be sorted in several ways: alphabetically, as it is in the data source or in a personalized way.
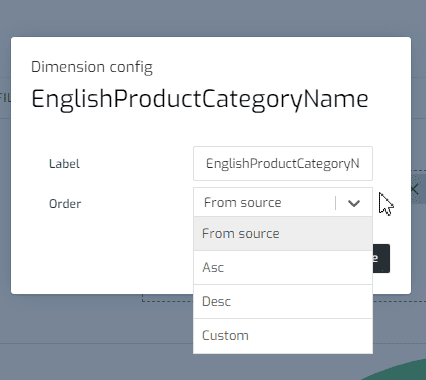
Custom sorting:
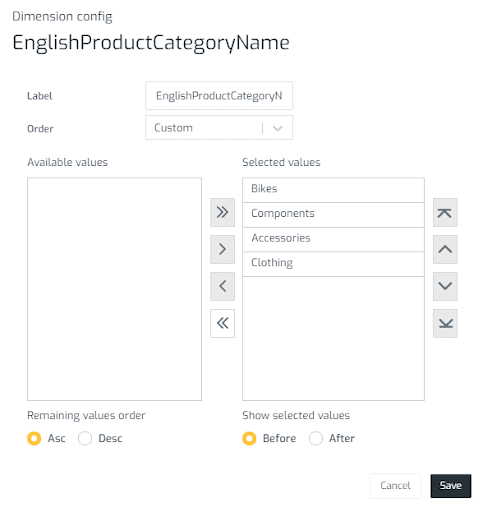
Improvements:
- Data card editor: Set as default color for every text in a card the first option of the available colors in the color palette. This means that a color from the palette is always selected by default.
- Visualizations - Charts: Added sorting by metric option in charts with broken by another dimension option enabled, e.g. bar charts.
- Data card editor: Added a message and a graphic when there are changes in the queries configuration or in visualizations.
- Pages and Cards: Added graphics to pages and detail view of a card when the option to apply filters automatically is turned off. This way the user knows that is necessary an action on its side to obtain data.
Bug fixes:
- Conditional styles: Fixed an issue that prevented the style to apply when having an expression “less than” 0.
- Data card editor: Fixed an issue that resets formatting to the default value when editing a field configuration.
- Data card editor: Fixed an issue in the color palette selection for chart cards.
- Visualizations - Cross Table: Fixed an issue with calculated fields without an aggregation.
Biuwer 1.13
New functionalities:
- Duration time metrics: Added duration time metrics that enable visualizations in time format. This allow Biuwer to show durations that can have different levels (seconds, minutes, hours, etc.) in a time format (e.g. 2h 35m 15s). This kind of metrics are available in all visualizations types.
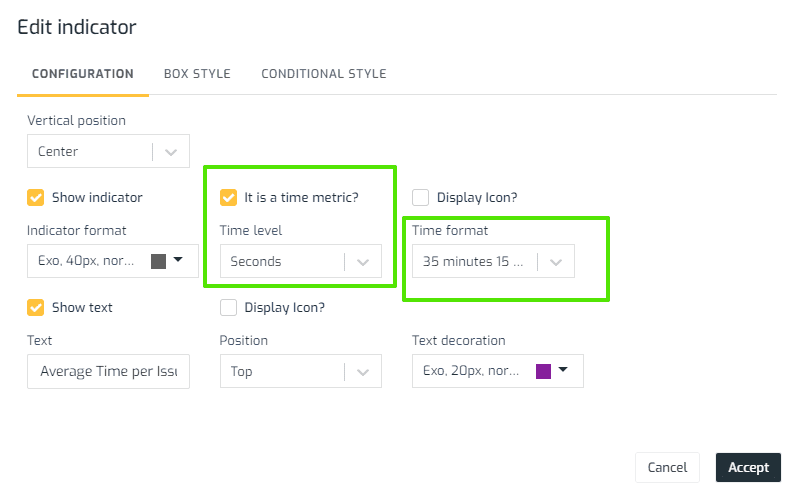

Improvements:
- Filtering system: From now on, the option “apply after grouping” is not allowed to configure in field filters with dimension type fields. This option is only available for field type filters and only with metric type fields.
- Filtering system: Improved user interface.
- Filtering system: Added mandatory filter option. If a mandatory filter is added to a page or card, it’s necessary that the filter has a valid value or expression to execute data queries.
- User interface: Added message and graphic when a page has no content.
- Cards: Added a new field “title” and the option to show it. This title is unrelated to the card name.
- New users sign up: Activation link expiration time has been extended to one week. After the expiration time the link will not be valid and a new a welcome email will be needed.
- Notifications: Added a notification at the top of the screen when exporting card data to excel or csv.
- Notifications: Added a notification at the top of the screen when content is marked as favorite.
Bug fixes:
- Connect as another user (masquerade mode): Fixed an issue that appeared when returning to your initial session.
- My space: Fixed an issue that prevented some users to create content in its personal space.
- Visualizations - Cross table: Fixed some issues in the cross table visualization (conditional styles, row heights, empty column titles, some cell formats).
- Visualizations - Vertical table: Fixed an issue when using interactive filters that caused them to not be applied when some page or card filter values were changed.
- Fixed a minor issue with the execute query button when coming back from changing structure page and content page.
- Control access dialog: Fixed an issue that prevented some users from seeing the owner of the object to share.
- User interface: Fixed an issue that prevented vertical scroll if the pointer was over a chart card.
- Fixed an issue when exporting a chart in PDF format.
Biuwer 1.12
New functionalities:
- Support chat: A support chat system has been added in the public website and Biuwer platform.
Improvements:
- Field format (Import Data System): Added support to specify formats to date, numeric and boolean type fields, so these data types are now available to import.
- Data card editor: Adjustments in date formatting and value cleaning criteria in the field visualization configuration.
- Data card editor: Styling and layout adjustments.
- Data card editor: Added more colors to the available palettes used in field configurations.
- Error notification: Added an error indicator in any data card whose queries have returned an error, indicating the error message in each case.
- User Interface: Minor changes.
Bug fixes:
- Error when cleaning filter values (Filtering system): Fixed an issue when cleaning filters that caused empty data visualizations.
- Fixed an issue with the labeling option in doughnut and line charts (Visualizations).
- Fixed an issue with numeric formatting in radar charts (Visualizations).
- Fixed an issue with the option to show x axis lines in charts (Visualizations).
- Fixed an issue with the selection of a field type filter having a numeric or boolean data type (Filtering system).
- Fixed an issue with user sign up having a not valid and not verified email (user sign up).
- Fixed an error message that appeared when a new Biuwer version was detected.
- Visualizations: Fixed an issue that caused some date formats not showing correctly in some chart types.
- Connect as another user (masquerade mode): Fixed an issue with data cache that caused from the previous session to be displayed, to which you have previously connected as another user.
- Data card editor: Fixed an issue when sorting by a field not used in visualization. Sometimes it is necessary to sort by fields that are not used in data visualization.
- Filtering system: Fixed an issue with date filter type when using a “between”' expression that caused the filter to not be applied correctly.
- Filtering system: Fixed an issue in the filter editor when a query returned an error.
Biuwer 1.11
New functionalities:
- My Space: A new personal space has been added for each user. In its personal space, any user can create pages and cards only visible for themselves. Once a user has created content in its personal space, it can be copied or moved to a shared space.
- Favorites: A new functionality to add spaces and pages to favorites. Now you can mark as favorites a space or page. By default you will see your favorite elements at the beginning of the selected visualization.
- Gauge and Bullet data visualizations: Two new data visualizations types have been added, bullet chart and gauge chart.
Improvements:
- The sign up process has been improved. From now on, every new user created in Biuwer will have to be validated through a link sent to its email account.
- Filter system: filters area is not shown if no filters have been added yet.
Bug fixes:
- Fixed an issue with date formats when exporting to PDF.
- Fixed an issue with data card editor by which some times was displayed without any content.
- Minor corrections:
- Fixed an issue when deleting a user’s default organization.
- Fixed an issue that caused double scroll in vertical table cards.
Biuwer 1.10
Improvements:
-
Improvements have been made in the data card editor. The following functionalities have been unified in the “query” tab: aggregation functions, field type, date level in date fields, etc.
-
“Always apply” option has been added to Data Policies: If this option is active, the dataset where the data policy is been applied is always added in the data models (so a join including this dataset is forced) where this dataset is configured. With this action, some security concerns are avoided in the visualizations where there aren’t any fields from the dataset affected by the data policy.
Biuwer 1.9
New functionalities:
- Biuwer updates: From now on, when a new Biuwer version is detected, a message will pop up in the top of the screen notifying that a new update is available.
Improvements:
- Query log: New metadata has been added in the query log storage.
- Data Card Editor: Some styles had been adjusted in the new query editor.
- Selected filters visualization has been improved in filters area.
- Improvements in the value selection for “all values” filters.
Bug fixes:
- Undesired scroll in dialogs: Fixed an issue that caused vertical scroll in dialogs when using some versions of Google Chrome.
- Access control dialog: Fixed an issue with the list of users with access, it wasn't displayed correctly.
- Query engine: Fixed an issue with Big Query (Google Cloud) connector that didn't allow to use expressions in calculated fields in the Group By section and Order By section.
- Data Center: Fixed an issue in the aggregation levels when selection “none” as aggregation.
- Data Card Editor: Fixed an issue when creating a card without any field selected. From now on, “visualization” tab is not enabled until at least one field has been added to the query.
- Data Card Editor: Fixed an issue when trying to delete a field from “interactive columns” section in a vertical table.
- Styling corrections in form elements while using Firefox browser.
Biuwer 1.8
New functionalities:
- Loading data from Excel file (Data import system): As with the import of CSV files functionality, Biuwer users can now import data from an Excel file
Improvements:
- Filtering system: A selection option is added for "All values" that selects all the values of a field type filter
- Filtering system: NOT operators have been included. Now you can filter data with expressions like "Not equal to" or "Not in the list"
- Add stage HAVING (Filtering system): An option is added in the filtering system to activate the aggregation stage through HAVING. This option allows filtering metrics after aggregation is done
- Filter options in Data Policies (Data Center): Within a dataset, not all filtering options were available. Now you have the same filtering options as in the pages / cards filtering system
- KPI Card (Visualizations): The KPI card is improved in such a way that different zones can now be added on the same card
- Card Editor: Several improvements have been included in the user interface of the data card editor page
- Expand date formats (Visualizations): The date formats available to the user have been extended
- Include aggregation functions by default (Data Center): It has been added the functionality of being able to select in a dataset the aggregation function by default (sum, average, count, count distinct, minimum, maximum)
- Visualizations: Added an option to set a default value in the color selector
Bug fixes:
- Aggregation in calculated fields: A problem that was causing to apply always an aggregation to a calculated field has been fixed. Now if "Aggregation: None" is marked, the aggregation operation will not be applied
- Problem with vertical table scrolling (Visualizations): Fixed problem with scroll in vertical table type displays that appeared in certain screen resolutions
- Minor bug fixes
Biuwer 1.7
Improvements:
- International support: Numeric and date formats have been improved, increasing the number of formats that Biuwer users can select
- Vertical table cards (Visualizations):
- Fields of type Dimension can now have column totals with operations (count, count distinct, minimum, maximum) and custom formulas (using fields of the table)
- The user can activate the inclusion of a first column showing the row number
- Conditional formats: Users can apply custom styling for rows and columns that meet the configured conditions
- Interactive columns: A selection of fields can be included as interactive columns to allow users to dynamically include them or not in the table
- Totals rows obtained and total rows shown: There is an option available to show these totals in the top of the table
- Data Card editor: Users can now change the type of a field, between metric and dimension and vice versa, regardless their definition in Data Models
- Sorting data (Query engine): Users can now include custom sorting of data, either the fields acting to sort the data are present in the data returned or not
Bug fixes:
- Pages export to PDF (Export data system): This option is now not available until the page has content within a defined page structure
- Vertical table cards (Visualizations): Search in columns with null values has been fixed
Biuwer 1.6
New functionalities:
- Boolean field support: “Boolean” data type is now supported in Biuwer. The new data type is mapped with the corresponding original data type for each data connector technology
- Upload data from CSV files (Import data system): Data contained in CSV files can now be uploaded to Biuwer datasets using the import data system, which include automatic detection of data fields and data types. This feature can be used to create new datasets or upload new data to existing ones using the append data option
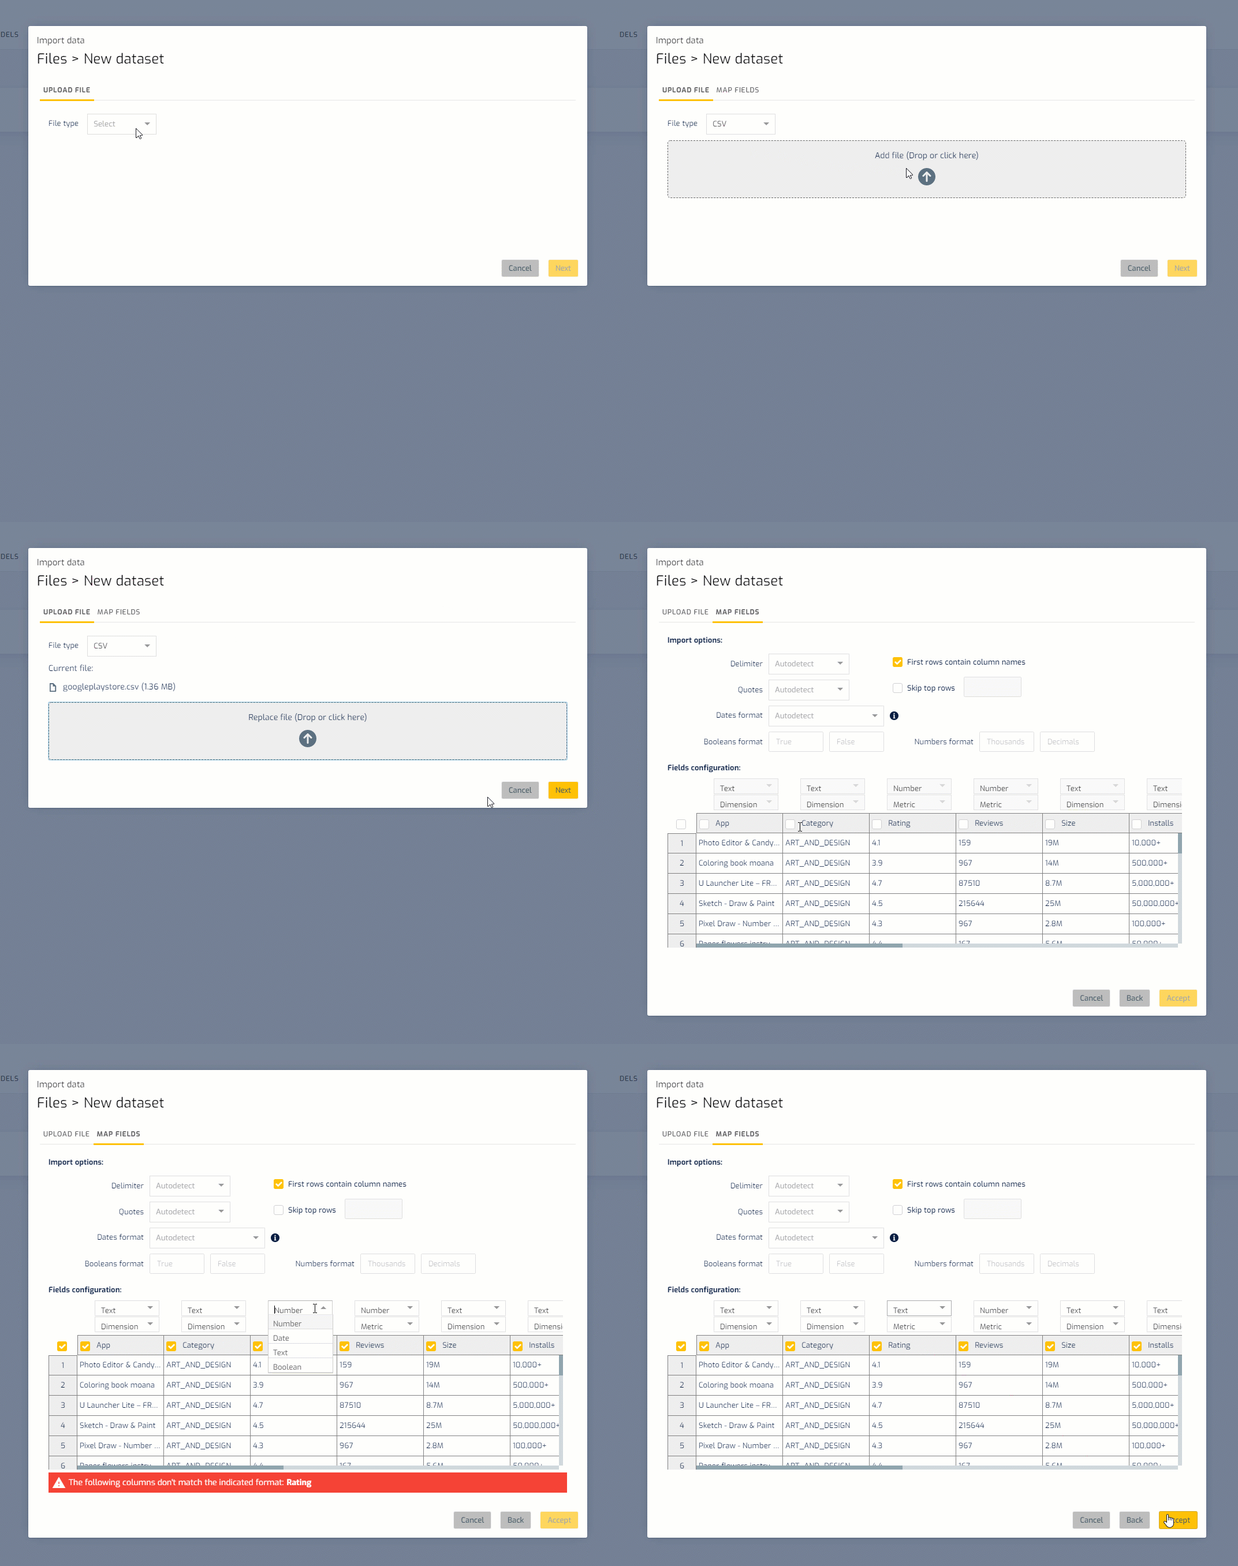
- Custom limit and sort options (Query system): Biuwer users can now configure per query row limits and custom data sort options (ascending and descending directions). This also applies to filter values, which are now sorted ascending. Existing cards and filters will remain as they are. New cards and filters will return by default a maximum of 500 rows
- New operators and boolean filters (Filtering system): There have been added new options in the operators catalogue. Now Biuwer users can filter boolean expressions
- Reverse engineering (Data Center): New Datasets can be added automatically in the Data Center using the new reverse engineering feature, that connects to the data source and obtains database structure and per table metadata (fields, data types)
Improvements:
- Query system: The core query engine in Biuwer has been improved. It now uses internal fields identificators in order to improve speed and avoid user mistakes with fields original names and aliases
- Controlled deletion of entities: Biuwer now checks for dependencies and shows them to the user when deleting any entity. This guides the user through the dependent items to avoid metadata inconsistencies
- Mailing system: Notifications and transactional emails are now being delivered by our new email partner Postmark
- New organization switcher. Biuwer users with more than one organization (account) can now use the new organization switcher, which shows organizations in a drop down instead of a list of items
- Cards heights: Cards general configuration height parameter has been improved to allow users to build custom pages with several cards configurations
- Custom cards: Internal improvements to use the core query engine
- Export data system: Exports to Excel files now include calculated fields
Bug fixes:
- Query system: Avoid unnecessary aggregations with calculated fields that use aggregation functions inside
- Datasets (Data Center): From now on hidden fields won’t appear in the Data Card Editor or in the Filtering system, so they can not be used until marked as visible again
- Date filters (Filtering system): Fixed some date level values for all connection technologies and the preview of date expressions
- Chart cards: Fixed a blinking when hovering over the chart
Biuwer 1.4
New functionalities:
- Data Policies: Now Biuwer users can define row level access for each dataset. You can configure custom filters for each user or users group
- New notifications system: A unified notification system has been built to show success, warning and error messages inside the app. This system will be improved to show custom content in each notification
Improvements:
- Public website. A mobile friendly main menu has been added. The menu automatically adapts itself with the available screen size
Bug fixes:
- Cards can now be visualized in mobile devices, adapting themselves to the available screen size
- Users can properly specify a list of allowed values in the filters configuration dialog
Biuwer 1.3
New functionalities:
- Move and duplicate. Now you can duplicate and move Cards and Pages between different shared Spaces
- Notifications system: An area has been included in the top center to show the notifications of the events that happen in Biuwer during its use.
- Uniform delete dialogs have been included for all objects
Improvements:
- Cards contextual menu have been improved
- Custom cards: Added file upload functionality in card configuration dialog with self-managed cloud storage
Bug fixes:
- Vertical table: Now you can filter a column with “null” values
- Vertical table: Now the panel of interactive fields closes when pressing or interacting outside of it, before only when the "Apply" button was pressed
- Data Center: Deleting a dataset functionality has been fixed
Biuwer 1.2
New functionalities:
- Access control heritance: Now you can share a space, page or card with a group or user and allow all of your children to inherit this configuration
- New Biuwer website published - www.biuwer.com
Bug fixes:
- Minor bugs fixed
Biuwer 1.1
New functionalities:
- Multi-language system: Available languages right now are English and Spanish
- Masquerade mode: admin users can now “connect as another user”
- Activate, deactivate and delete users from an organization
- Data cards export system in PDF, CSV and Excel formats
Bug fixes:
- “Basic” predefined role is always assigned to “All users” group
- Extended the maximum number of items for platform objects
- Fixed flickering when opening a page with content
Biuwer 1.0 - Biuwer first release is now public!
Biuwer, our new cloud data platform is available with these main functionalities:
- Content is structured in Shared Spaces, Pages and Cards.
- 4 main types of data Cards:
- KPI cards
- Vertical table cards
- Cross table cards
- Chart cards
- 12 types of charts, all responsive and fully configurable.
- Custom cards: Cards developed for any need or application (Biuwer team engineered for now)
- Advanced filtering system.
- Multi-tenant system:: Need more than one account? You can do it with Biuwer
- Complete security system with SSL authentication
- Users
- User Groups
- 5 available Roles
- Content access permissions, with view, edit, admin and owner levels.
- Data center: Configure connections to your data sources
- Connections
- Datasets
- Data Models
- Available connectors:
- MongoDB
- SQL Server + Azure SQL
- Oracle DB
- MySQL
- MariaDB
- PostgreSQL
- LiteDB
- Google BigQuery
- Google Cloud SQL (MySQL and PostreSQL)
- Amazon RedShift
- Files in FTP/SFTP servers