Product updates
June 26, 2024
January 2023
New functionalities:
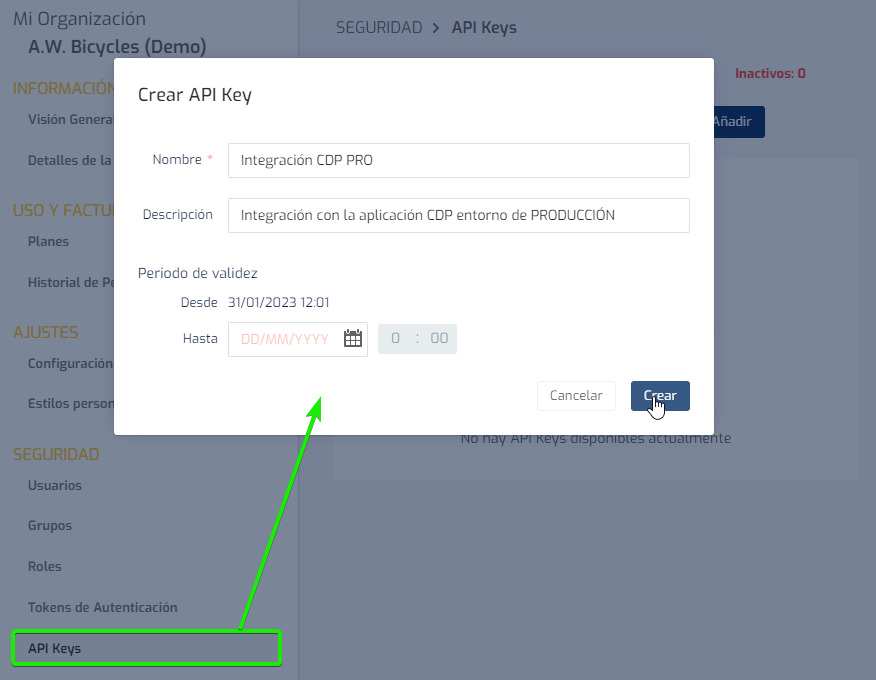
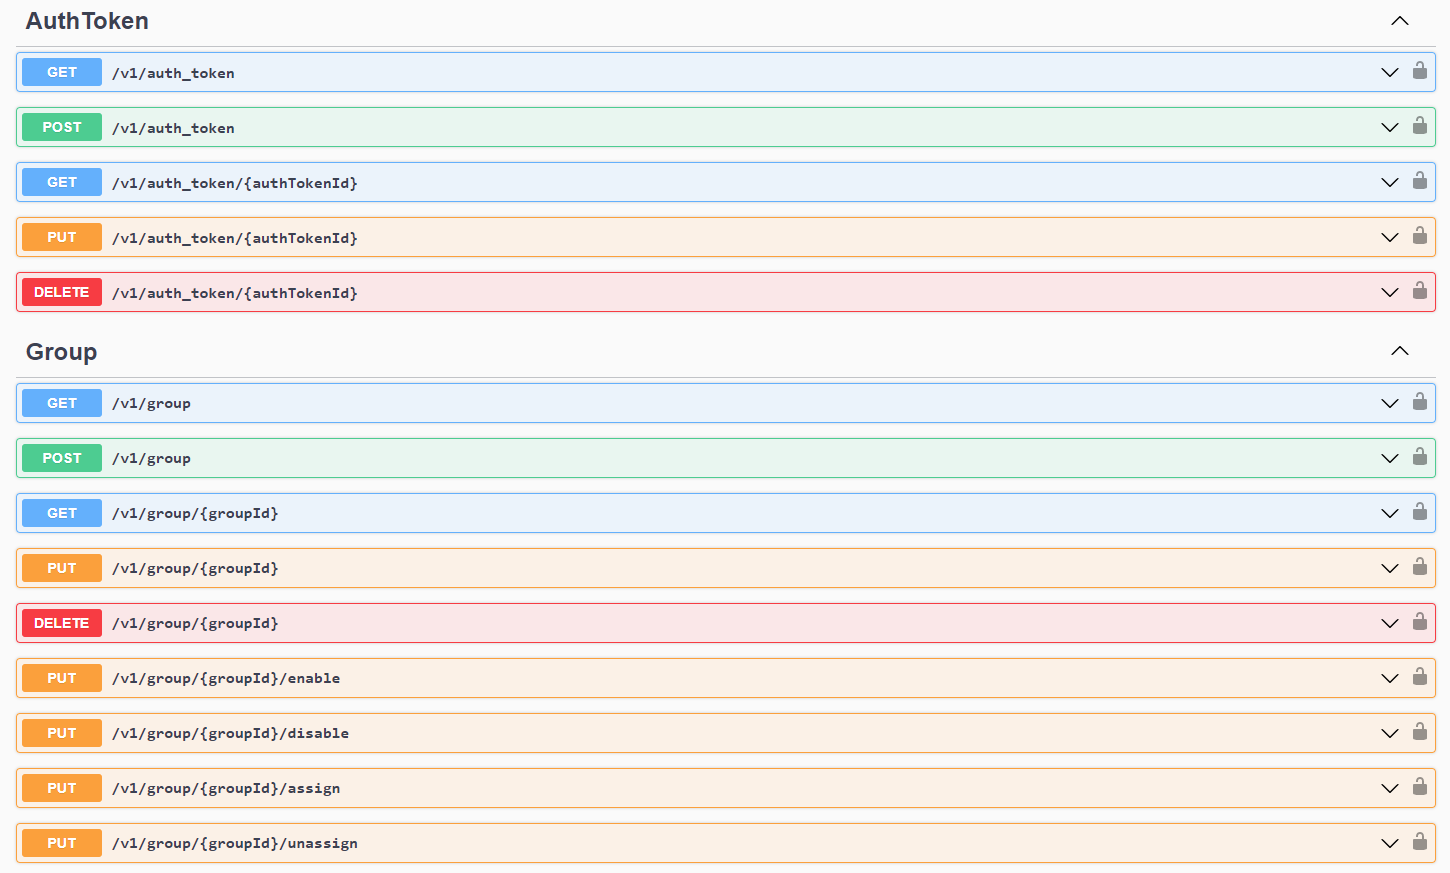
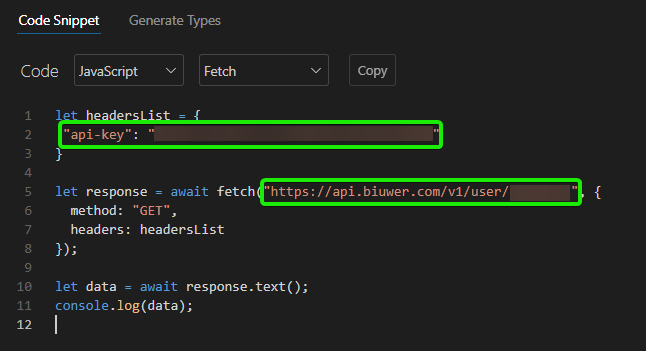
- Biuwer Public API is now available. This functionality marks a before and after in the integration possibilities of Biuwer in external applications, since it allows automating the management of all those tasks related to user management, authentication tokens, user groups, configuration of data and content permissions, etc. How is it used? The first step is to configure an API KEY in the Biuwer administration area. Subsequently, in any web application, include the API KEY in the header in the HTTP calls, for the different endpoints available in the public API. Use the base URL https://api.biuwer.com/ to compose the calls to Biuwer's public API. We are expanding support to be able to work with other parts of the Biuwer platform through the API and thus be able to automate integrations with third-party applications (Embedded Analytics).
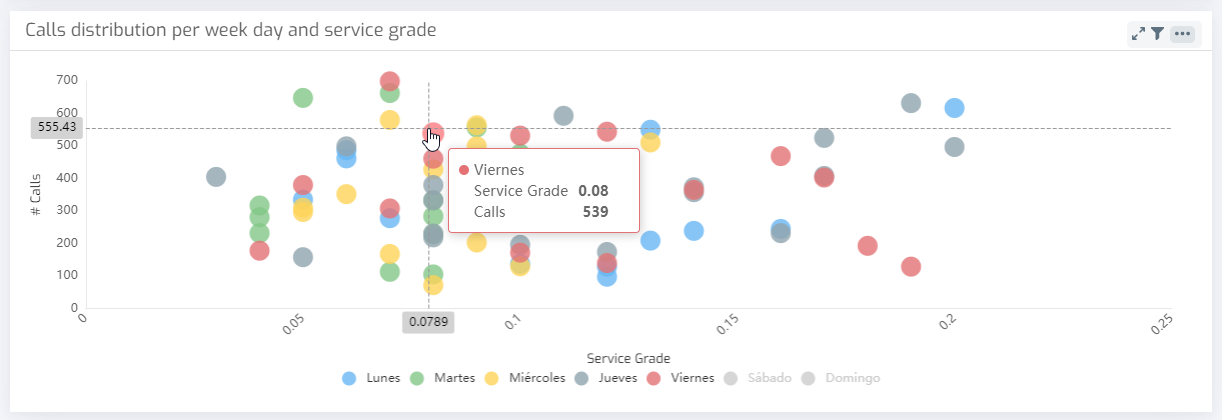
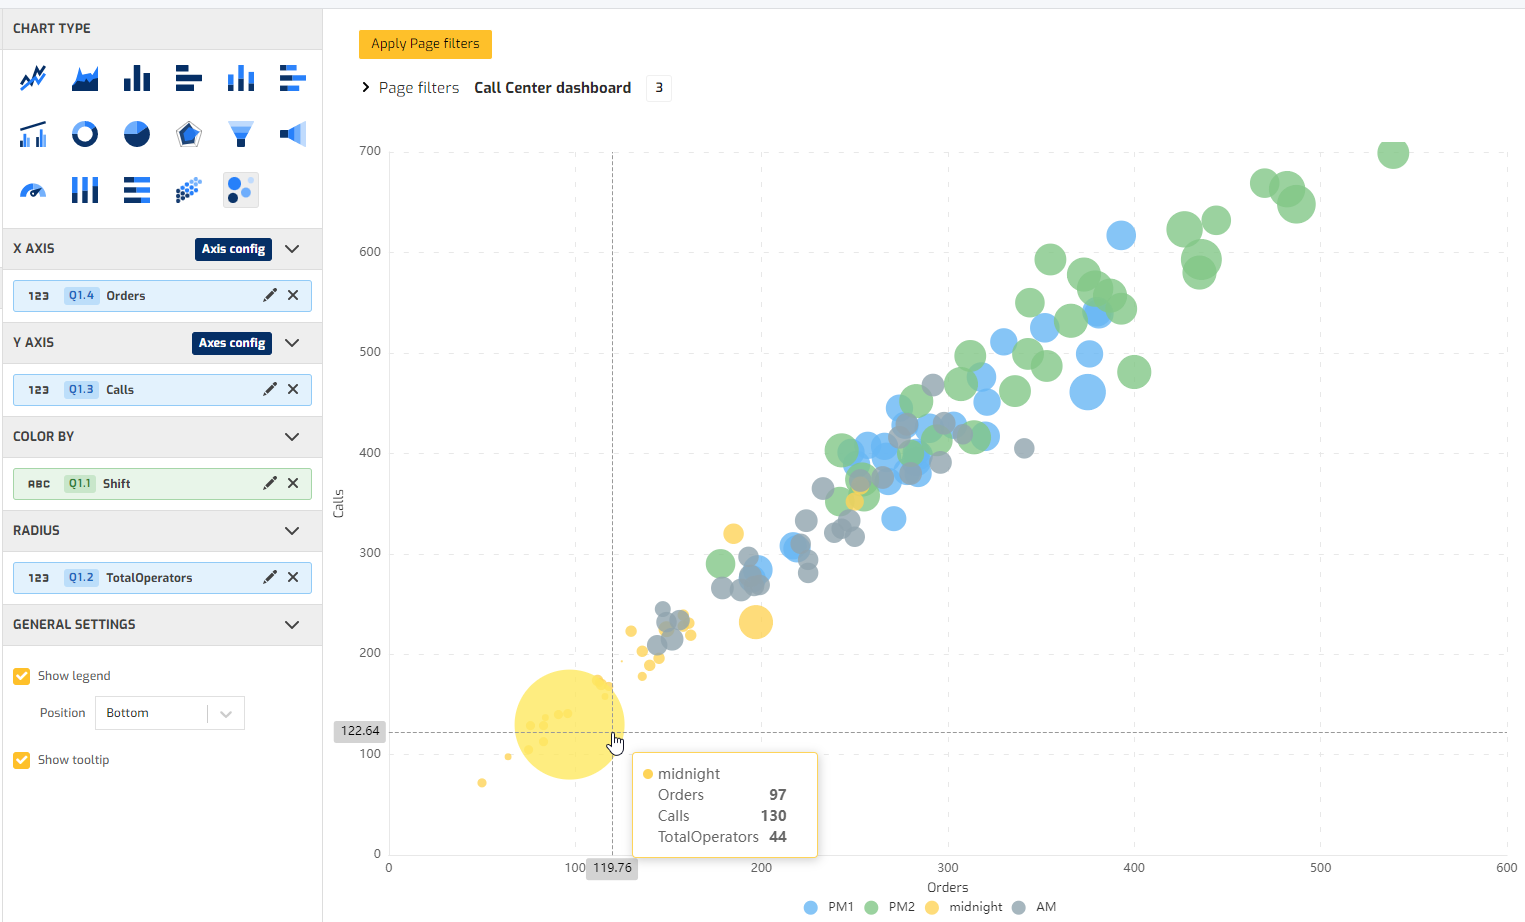
- New chart types: scatter plots and bubbles charts. With these two types of charts, visual analysis can be performed on the values taken by two or more fields of a Dataset. Specifically, these visualizations allow the user to search for relationships between different variables. These charts display your data as points or circles on a chart using the X (horizontal) and Y (vertical) axes. The use cases are multiple, such as finding atypical values (outliers), direct and inverse correlations, trends, etc..
Improvements:
-
Filtering system: better assignment of filters to data cards with multiple queries.
-
Data Blending: improvements in the data blending system between several queries of data inside each card, with support to various types of fields.
-
Chart cards: improvements while interchanging between the various chart types available.
Bug fixes:
- Data Card Editor: users can now delete fields in the data card editor even if there are errors in any calculated field, as well as fields that are being used in visualizations.
- Numeric formats for currencies in charts have been adjusted.
- Basic users have access to visualize maps data cards.
- Other minor fixes.