Product updates
June 26, 2024
December 2022
New functionalities:
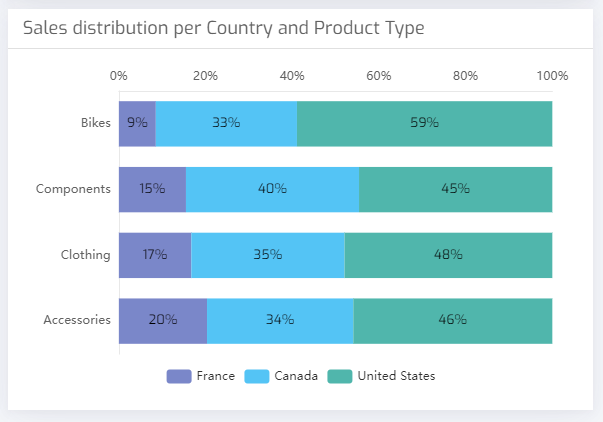
- 100% stacked bar charts. With this new type of chart you can easily visualize the distribution of values that any metric takes in Biuwer. The chart automatically calculates the weight that each value has over the total. You can configure how to display the labels and tooltips, both in vertical and horizontal format.

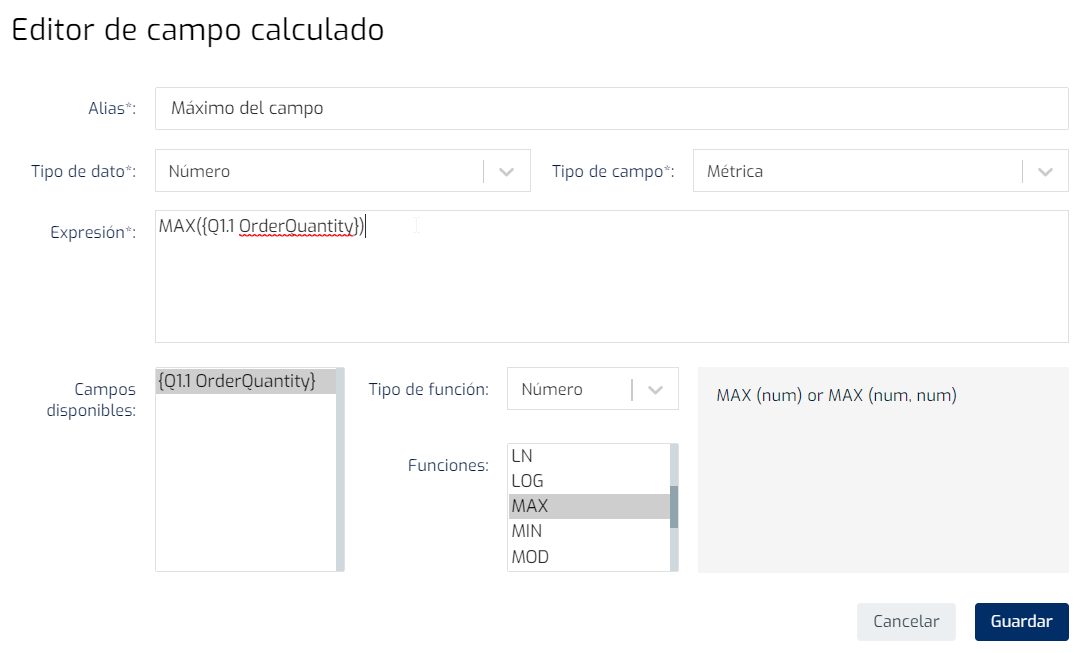
- New numeric operators available in Card Editor expressions. The following operators are now available: ABS, CEILING, DIV, EXP, FLOOR, LN, LOG, MAX (of a field or between two values), MIN (of a field or between two values), MOD, POWER, ROUND, SIGN, SQRT, SQUARE. For more information, check out our documentation site and tutorials.

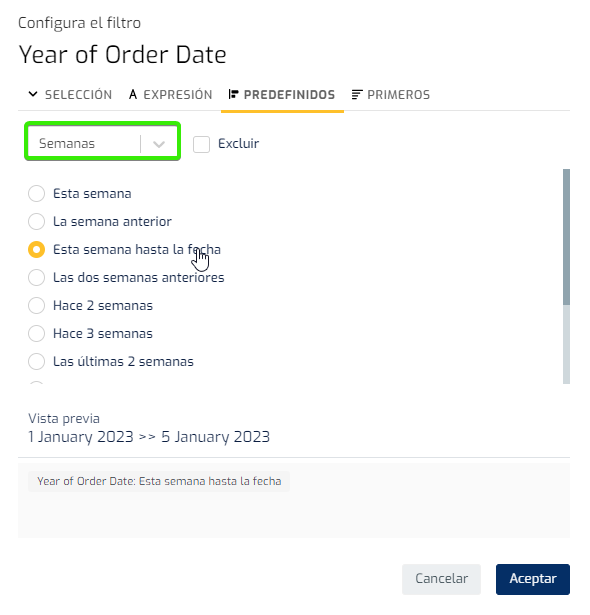
- New Week level available in the filter system and new special values "to date". With this novelty, users can now analyze weekly periods more easily. Among the added options are: “This week”, “Last week” or “The last 2, 3, 4, 6, 8 and 12 weeks”. Special periods have also been included: “Week to date” (WTD), “Month to date” (MTD), “Quarter to date” (QTD) and “Year to date” (YTD).

Improvements:
-
Card printing: From now on the title of the card is shown. Until now, when a user exported a card, the name of the card was used, which is not bad, but sometimes it is used internally by the content manager to identify or differentiate between cards.
-
Improvements in the Biuwer charting system, with which better use is made of the available spaces in general and especially in the axes that have been configured.
-
Support for applying filters to multiple queries when duplicating pages and cards is now available.
Bug fixes:
- Tooltip on table actions: The full cell value is now correctly displayed when hovering over values in fields where a navigation action has been configured.
- Chart label colors: The default colors are now displayed correctly in chart labels in all cases.
- Fixed a problem when creating calculated fields in data sets managed by Biuwer.
- Other minor fixes.