Being able to design and manage a profitable business model is the main objective of any eCommerce. To know its profitability and to be able to successfully run the business, it is essential to analyze and measure its results. This implies knowing which are the most important KPIs (Key Performance Indicators) for your online store, since they are the ones that will help you make the best decisions.
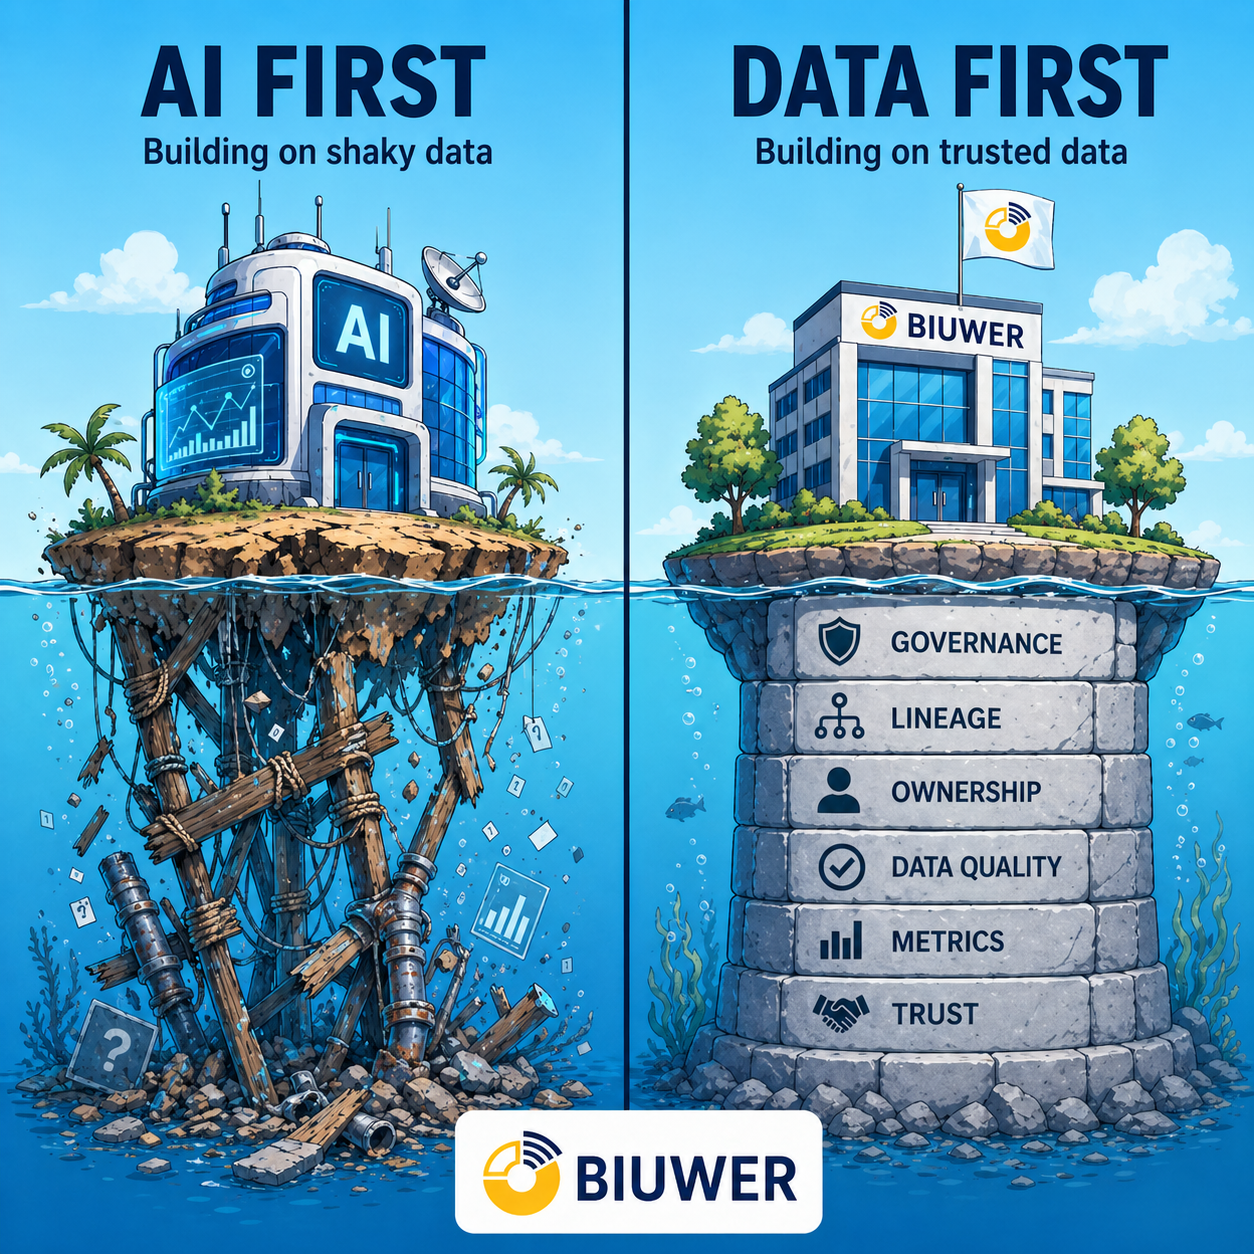
Managing an ecommerce is not easy. A lot of time, money and effort are invested in increasing visits, sales, etc. Measuring results allows you to better manage your resources, but there are many sources of data, and analyzing them can be a headache if we want them to become helpful. To make this a simple task, there are platforms such as Biuwer, which allows you to automatically unify all your data, regardless of the tool used, so that you can easily understand it and make the right decisions.
What are KPIs?
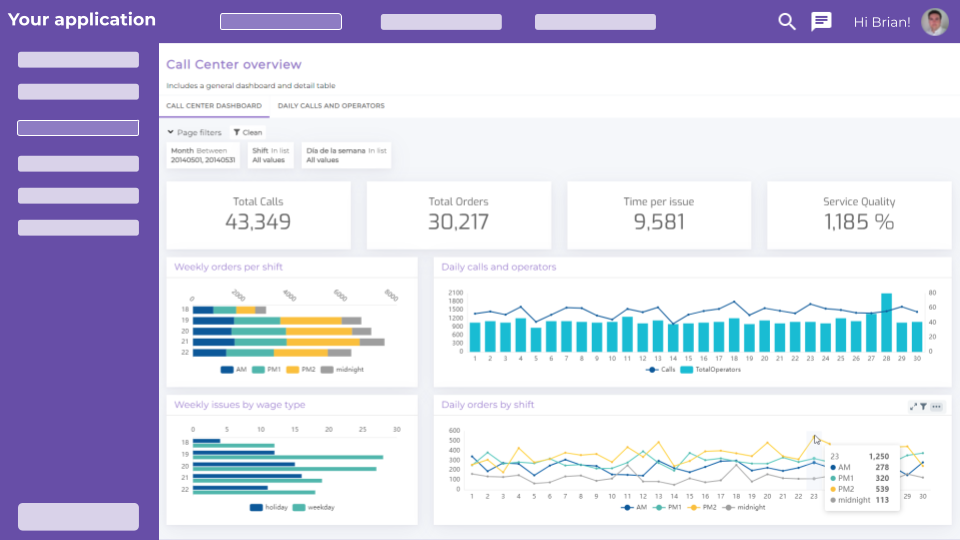
A KPI is a Key Performance Indicator that measures the level of compliance with a certain process. KPIs are the most relevant metrics for your strategy, the ones that determine your success or failure. It is common to arrange the KPIs in a summarized way in panels or dashboards, to have the global vision of the business at a certain moment. In addition, the KPIs are complemented with information at a more detailed level, which allows detecting individual problems and specific cases.
There are many types of KPIs, they can be qualitative or quantitative and also predictive of the future or revealing of the past, but to be truly useful they must meet the criteria of the SMART model, that is, they must be Specific, Measurable, Attainable, Relevant and Time-bound.
- S for Specific: that is, limited to a single relevant aspect, as clear and simple in its measurement and calculation.
- M for Measurable: that allows verifying its compliance in specific units (percentage, units, dollars, etc.).
- A for Attainable: that is, achievable, in the sense that they are realistic and can be carried out under the conditions on which they are defined.
- R for Relevant: that is, important and consistent with the mission and values of the company. Out of all the available KPIs, we should prioritize those that are most important, and that truly serve to measure and verify the level of success in a certain process.
- T for Time-bound: that is, referring to a period of time. The values of a KPI must be contextualized in specific moments in time, which will allow us to carry out follow-ups, see evolutions, make comparisons with previous periods, have future forecasts, compare with target values, etc.
Often the KPIs, which reflect achieved, past, current or even future values, are compared with target values, which we have previously marked for each KPI. As an example, it is as if in the management of the company, we have the monthly sales amount as KPI and we compare the monthly amounts with the annual budget. As it is understood if we extend this example, the KPIs can be broken down in more detail, for example, if we specify the sales made by each department, geography and product. The latter are the dimensions of analysis, which in addition to time, configure what happened in the different categories, attributes or parameters that we have in our business.
A very important aspect to take into account with KPIs is their trend. The very definition of a KPI must indicate in a natural way if we want to increase, decrease, stabilize, maximize, minimize or eradicate its values. For example, the conversion percentage, we want the bigger the better, and on the contrary, the shopping cart abandonment rate, we want the smaller the better.
Why are KPIs important?
Just as we establish objectives and a strategy, we need to establish metrics that allow us to measure the process and results over time. We already mentioned in our article How to make smart decisions based on data the importance of making logical decisions based on data and not on mere intuition.
Knowing what is happening in real time in your eCommerce is a competitive advantage since you will have all the details to act quickly when necessary, mainly to solve problems immediately and of course have the tools to decide, for example, what prices to raise or lower, what products to promote, what products to get out before from the available stock, which suppliers to promote or stop using, and a long etcetera.
KPIs that you should measure in your eCommerce
For eCommerce, we can distribute the KPIs in the following four categories. Of course, the choice of these and other KPIs will depend on what your strategy is, the specific market segment and the objectives you set in your business.
Sales KPIs
1. Total online sales
Perhaps the first thing to do is start by knowing in detail how much money we are selling. The detailed analysis of this KPI allows us to manage key aspects of our online store, such as including products with a certain seasonality, including other channels that help us expand, translating the platform into other languages to attract more audiences, etc.
2. Number of orders
It is a basic KPI that in itself does not add much value, but it is important to know in detail the volume of orders that our online store manages in order to optimize other aspects related to the operational management of the business (stock management, purchases with suppliers, logistics and shipping agreements, return policies, etc.).
3. Average order value (AOV)
AOV defines the average amount that a customer spends each time he buys from your online store. It is usually called colloquially as the "average ticket" of purchase and it is a very important indicator to understand the buying habits of your customers, which helps to evaluate and analyze the impact of digital marketing. The amounts are going to be highly dependent on the products you sell, but in general, we can improve AOV by incentivizing customers to purchase additional products through cross-selling strategies and product recommendations.
4. Cart abandonment rate
Did you know that, on average, 2 out of 3 eCommerce customers leave their cart abandoned? This is one of the main causes that can make you stop making money, users who have added products to their basket but do not finish making the purchase. Some of the most frequent causes are shipments, either because the cost is high / unexpected or the delivery time is too slow, complications in the checkout process or a lack of options are also common causes of cart abandonment.
5. Recurrence rate
It gives information on the percentage of visitors who have already visited the web before. It can indicate the degree of loyalty that we are achieving if it is broken down by source channels.
6. Conversion rate
Indicates the percentage of users who finally make a specific purchase or action (downloading a file, a reservation, a registration, etc.). It is one of the key metrics for eCommerce since it helps us to know how our business is doing, so it must be constantly evaluated. It is usually between 1% and 3%, although, of course, it all depends on the type of eCommerce and the actions we want to take.
7. New customer orders vs. recurring customers
If we have something clear, it is that bringing a new client has a much higher cost than maintaining a recurring client. Building customer loyalty can lead to “word of mouth” marketing, in addition to assuming a higher order value.
8. Returns and refunds rate
It is important to monitor this metric since, in the event that the percentage is too high, we must take the appropriate actions to reverse the situation. Having a permissive refund and return policy is a great claim to encourage customers to make a purchase, but it is important to ensure that it can be managed correctly without affecting the profitability of your eCommerce. It is calculated by dividing the number of returns by the total number of products sold in a period of time.
Marketing and advertising KPIs
9. Customer acquisition cost (CAC)
The CAC is a KPI that measures the amount of money it costs to acquire a customer, and is calculated by adding all the costs incurred in acquiring new customers (marketing actions, cost of associated personnel, tool costs ... ) during a period of time, divided by the number of new customers obtained in that same period. The value of the CAC is an amount in a certain currency, for example, € 50 or $ 60 and we want it to be as low as possible, which will mean that buyers are found with an optimal investment. As a general rule of thumb, purchasing costs should be kept lower than the average order value. It is advisable to track this metric across the entire eCommerce site as well as individual traffic sources.
10. Customer Lifetime Value (CLV)
The CLV shows what a user spends in our online store for as long as he is our customer. The CLV is often used to identify the most valuable customer segments. For example, if you make two purchases on average per year for 4 years and the average value of each purchase is $ 20, the lifetime value of that customer will be $ 160. We can improve this indicator through loyalty strategies that encourage repeat purchases.
11. Unique visitors vs. recurring visitors
For the growth of an eCommerce it is necessary for the number of recurring users to grow since, the greater the number of recurring users, the lower your CAC will be, since it is easier and cheaper to attract a user who already knows us than one who does not. you have heard of us.
12. Return On Investment (ROI)
The ROI is used to calculate the profitability of the strategy, the higher it is, the more profitable the action taken. Thanks to this metric we can calculate the conversions and the results obtained from a given investment. It allows us to visualize the performance of our work in addition to detecting failures or improvements. The ROI value is expressed as a percentage and is calculated by dividing the economic amount obtained after the investment minus the investment amount, by the investment amount. The result multiplied by 100 gives the ROI in percentage, which can be negative or positive.
13. Return On Advertising Spend (ROAS)
The ROAS allows us to measure how effective the advertising campaigns carried out are and to know which are the channels and media that are most profitable for your online store. The ROAS quantitatively evaluates the performance of advertising campaigns and how they contribute to the final result, it means the percentage of income obtained in relation to the investment made, and is calculated by dividing the income obtained by the expense incurred, multiplying the result by 100. The ROAS it should be greater than 100% in any case. With this information, you can distribute the budget in the best way to maximize results.
14. Subscriptions to your email list
One of the most powerful tools to promote your online store and nurture the relationship you have with your customers is email. Email marketing, in addition to having a very high ROI, allows you to organize your campaigns without depending on third-party platforms (Google, Facebook, etc.), send commercial communications, discounts and promotions, etc.
Customer service KPIs
15. Net Promoter Score (NPS)
It is a standard measure of customer satisfaction, it offers a vision of the relationship you have with them and the loyalty they have towards your brand. To measure the NPS, you have to ask customers through satisfaction surveys, because it is calculated based on the probability that a user recommends us to her family and friends. You can ask, for example, "How likely would you recommend us to a family member or friend?". Taking into account that it can be valued from 0 to 10, the responses can be grouped into three groups: promoters, passives or detractors. The NPS index ranges from -100 to 100, where zero or higher is considered positive, and NPS >= 50 or greater is considered excellent. On the contrary, negative values are considered low levels of loyalty, or general satisfaction. This KPI is so important that it has become the number one KPI in many digital companies, as it summarizes how well the entire company, customer service, its products and services works.
16. Attendance rate
What is the percentage of users of your store who contact your customer service? In general, we will want to keep this percentage as low as possible, because if it is very high, it is possible that the cause is that the information you offer about payment methods, shipping policies, returns, etc. is not clear enough. So that users can solve their doubts quickly without having to contact you, it is important to have a FAQs (Frequently Asked Questions) section with clear and detailed information.
17. Churn Rate
This KPIs indicates the percentage of customers who stop buying from your online store for a long period of time. The lower this percentage, the more loyal our customers will be. It is one of the most important metrics for those eCommerce whose business model is based on subscription or recurring purchase. If this rate is higher than expected, you can implement strategies to retain your customers, such as special offers and even exclusive premium plans for members. Does Amazon Prime sound familiar to you?
Traffic KPIs
18. Traffic per device
It is important to know where your customers come from in order to offer them a great experience in your eCommerce. Your online store must be optimized for any device. Segmenting the traffic by device allows us to know if the usability for any of the devices is not being optimal and to be able to improve it, this is essential for a good user experience.
19. Conversion rate by traffic source
Some traffic sources direct visitors to your eCommerce who are more likely to become customers. This information is very useful as it allows you to optimally manage your marketing budgets.
20. Origin of income
With this metric you will be able to know which channel your income comes from (social networks, direct traffic, organic traffic, paid traffic, etc.). This is interesting not only to know which source provides you more income and in which you should invest more resources, but also to detect trends and optimize your marketing budget. It is calculated by breaking down the total income in each of its channels of origin (search engines, social networks, newsletter, etc.), but of course, for this it is necessary to have the digital tools that provide this information, known as Digital Marketing Attribution tools.
How to earn more money using KPIs every day?
Finding and organizing the reference data with which to make estimates about the evolution of a business, understanding why its conversion rate has not improved and how to reverse this result is one of the biggest challenges for an eCommerce.
There are many tools, each one generating data and a lot of scattered and valuable information that takes a lot of time and effort to gather and analyze correctly. In addition, data analysis is not something that should be done once, but should be part of your daily work philosophy, so you will obtain the best results.
It is important to have the right tools that allow you to unify the data automatically and allow you to have the KPIs that are important for your business in one place. It is also important to keep in mind the phases of the sales funnel, since the KPIs that are selected will be associated with each of the stages: discovery, consideration, conversion, retention and recommendation.
And how to earn more money and save more time? Well, simply, using digital data tools that offer you relevant information around the KPIs that are the most valuable for your business, updated, if possible automatically, so that your time is used to make the business more efficient, to make decisions that are derived or suggested by the data, to solve the detected problems, etc. And all this, every single day, there are no magic recipes.
Do you want to know quickly and easily what is happening in your online store? Biuwer for eCommerce makes it very easy for you as it is a plug and play solution with predefined and customizable KPIs that will help you make the best decisions. In addition, you will periodically receive personalized reports with high-value insights and recommendations about your online store. If you want to save time, money and effort when analyzing your eCommerce data, this is the solution you need. Contact us for more information.