December 2024
New functionalities:
- New vertical and cross tables. Tables are undoubtedly the most basic, direct and common visualization elements that we have. Given their importance, we have been working during the last few months on new tables, both vertical and cross, which significantly improve the behavior of the previous ones, incorporating new functionalities and allowing future developments, such as the following:
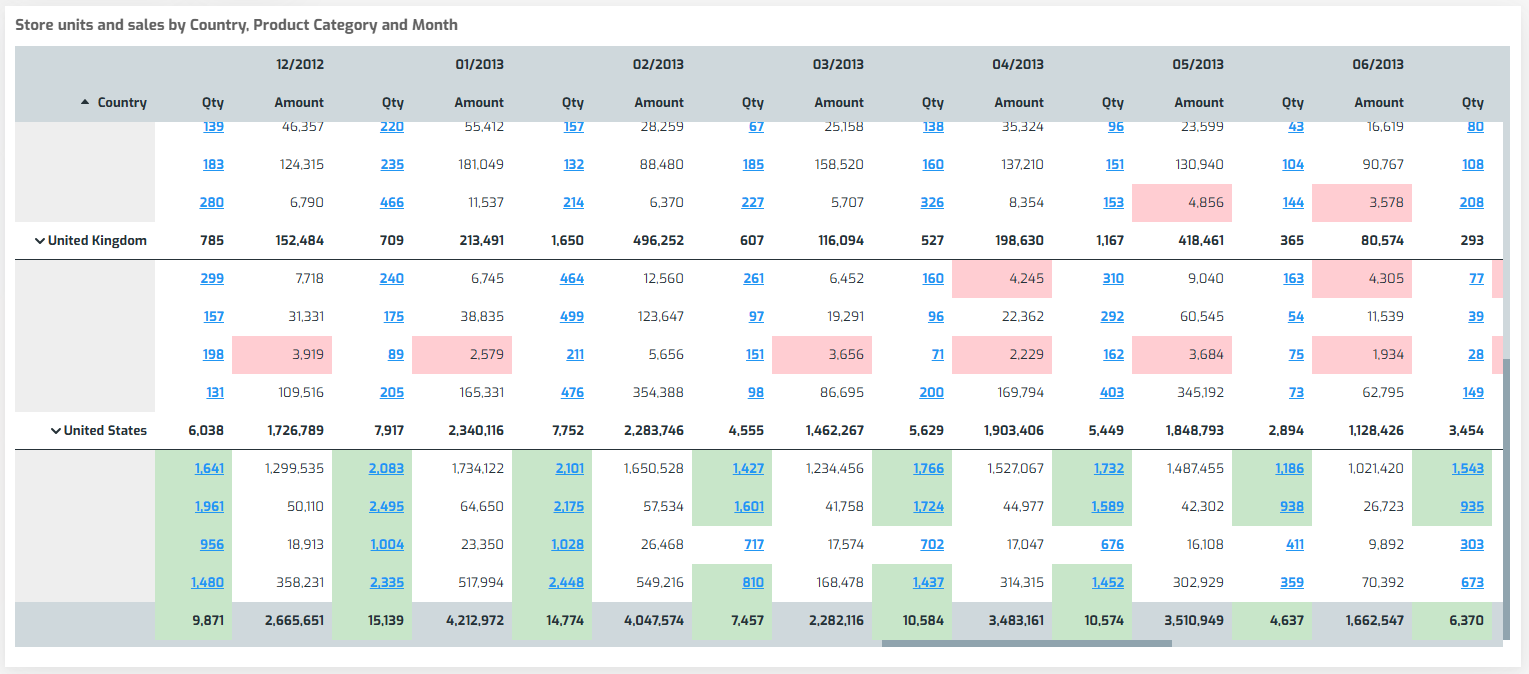
» Improved performance for viewing large amounts of data. Especially in cross tables, the processing of up to hundreds of thousands of rows has been optimized.
» Grouping of values, with the option of expanding or contracting subtotals. Very useful when you want to analyze several subtotals on a total.
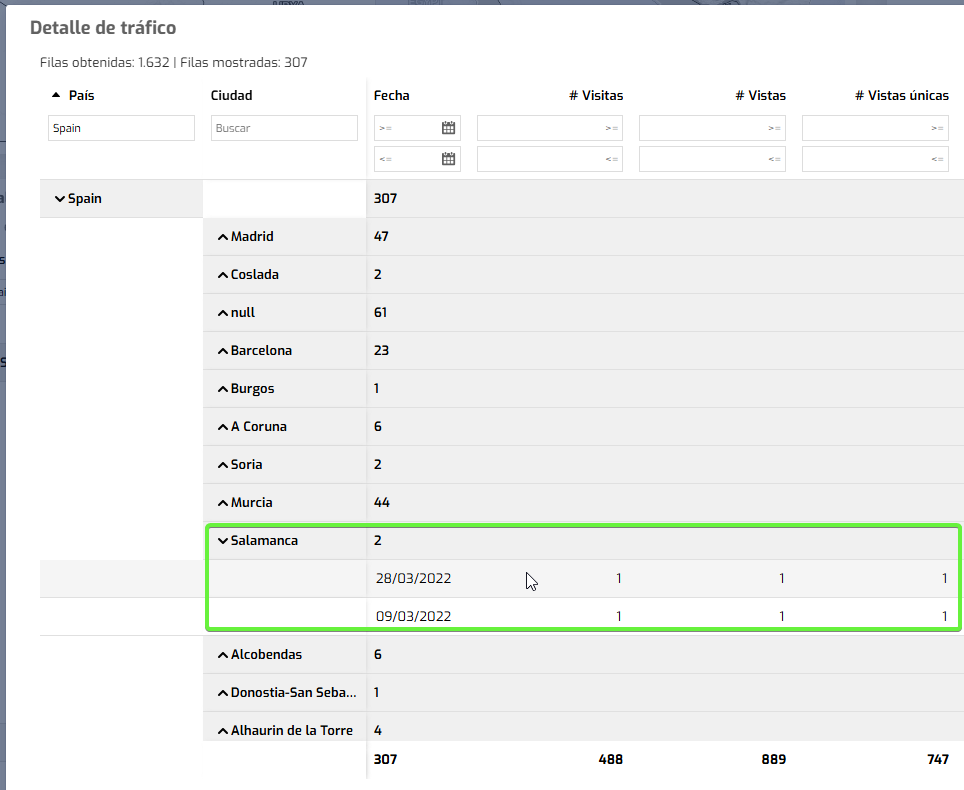
» Interactive filtering using a value selector. Very interesting for showing the different values of a field and being able to quickly filter by one of them.
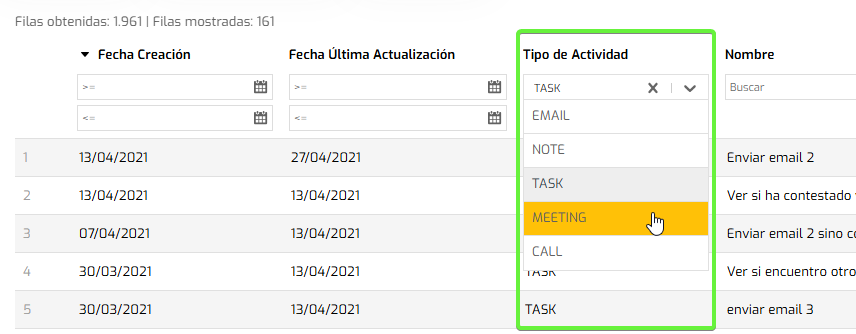
» Fixed fields, on the left or above, to facilitate reading with horizontal and/or vertical scrolls.
» Faster customized row styles for all fields.
» Improvement in the printing of cross tables. Now the table is exported to the different formats, just as it is represented on the screen.
» Prepared to apply Biuwer's Themes system (predefined and custom themes).
» Prepared to apply Biuwer's Interaction system (Cross Filtering, etc.)
» Prepared to include custom cell visualizations (Buttons, Spark lines, embedded bar graphs, etc.)
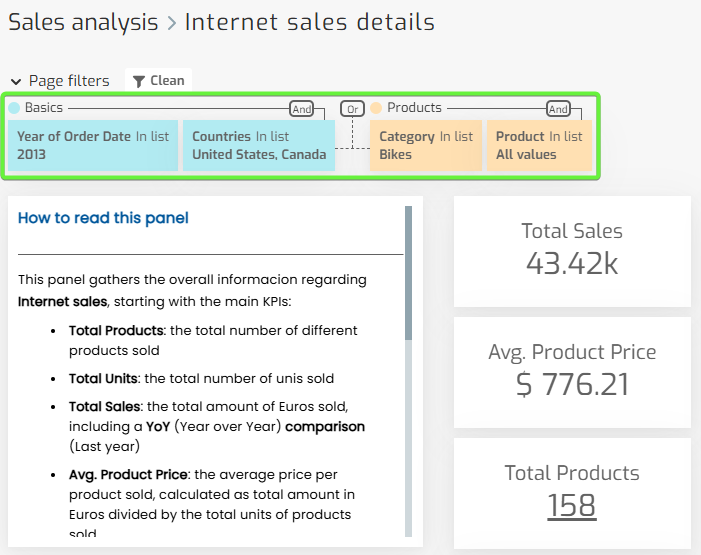
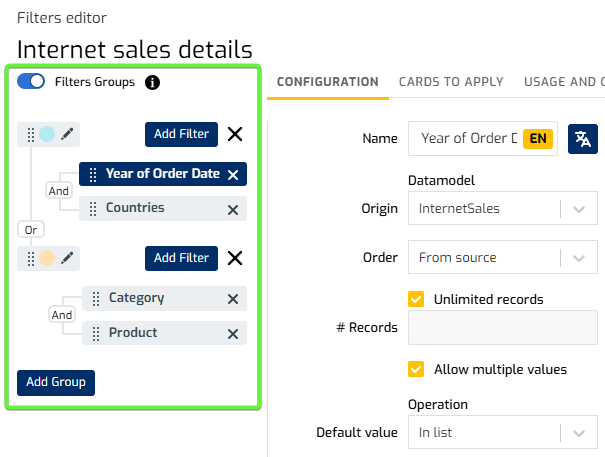
- Filter groups, with AND/OR boolean logic. The filter system in Biuwer allows you to configure data visualizations in multiple ways, and with this update it evolves even further, by including Filter Groups. This includes the possibility of configuring boolean logic with AND or OR operators, while you can visually configure filter groups using a title and a color. You can configure filter groups from the Professional Plan, both on Pages and Cards directly.
-
New Text Functions in Card Calculated Fields. New functions for working with text strings are available with this update. In the card editor you can use the following functions in your calculated fields: CONTAINS (indicates whether a text string contains another), ENDS_WITH (indicates whether a string ends with another), STARTS_WITH (indicates whether a string begins with another), CAPITALIZE (capitalizes the first letter of each word), LOWER (makes the entire string lowercase), UPPER (makes the entire string uppercase), FIND (finds a text string within another), FINDNTH (finds the occurrence of one or more times of a text string within another), LEN (indicates the length of a string), LEFT (gets the first N characters of a string, that is, starting from the left), RIGHT (gets the last N characters of a string, that is, starting from the right), LTRIM (removes blank spaces from the left), RTRIM (removes blank spaces from the right), TRIM (removes blank spaces from both ends), SUBSTRING (gets a substring), REPLACE (replaces one string with another), SPACE (creates a string with N spaces), and SPLIT (gets a substring using a delimiter character). Learn more here
-
New Statistical Functions in Card Calculated Fields. We have new, very useful functions to know more about the data and show users meaningful calculations on hidden details within the data sets. In the card editor you can use the following functions in your calculated fields: MEDIAN, MODE, STANDARD_DEVIATION, PERCENTILE, QUARTILE, TERCILE, VARIANCE, CORRELATION. Learn more here.
-
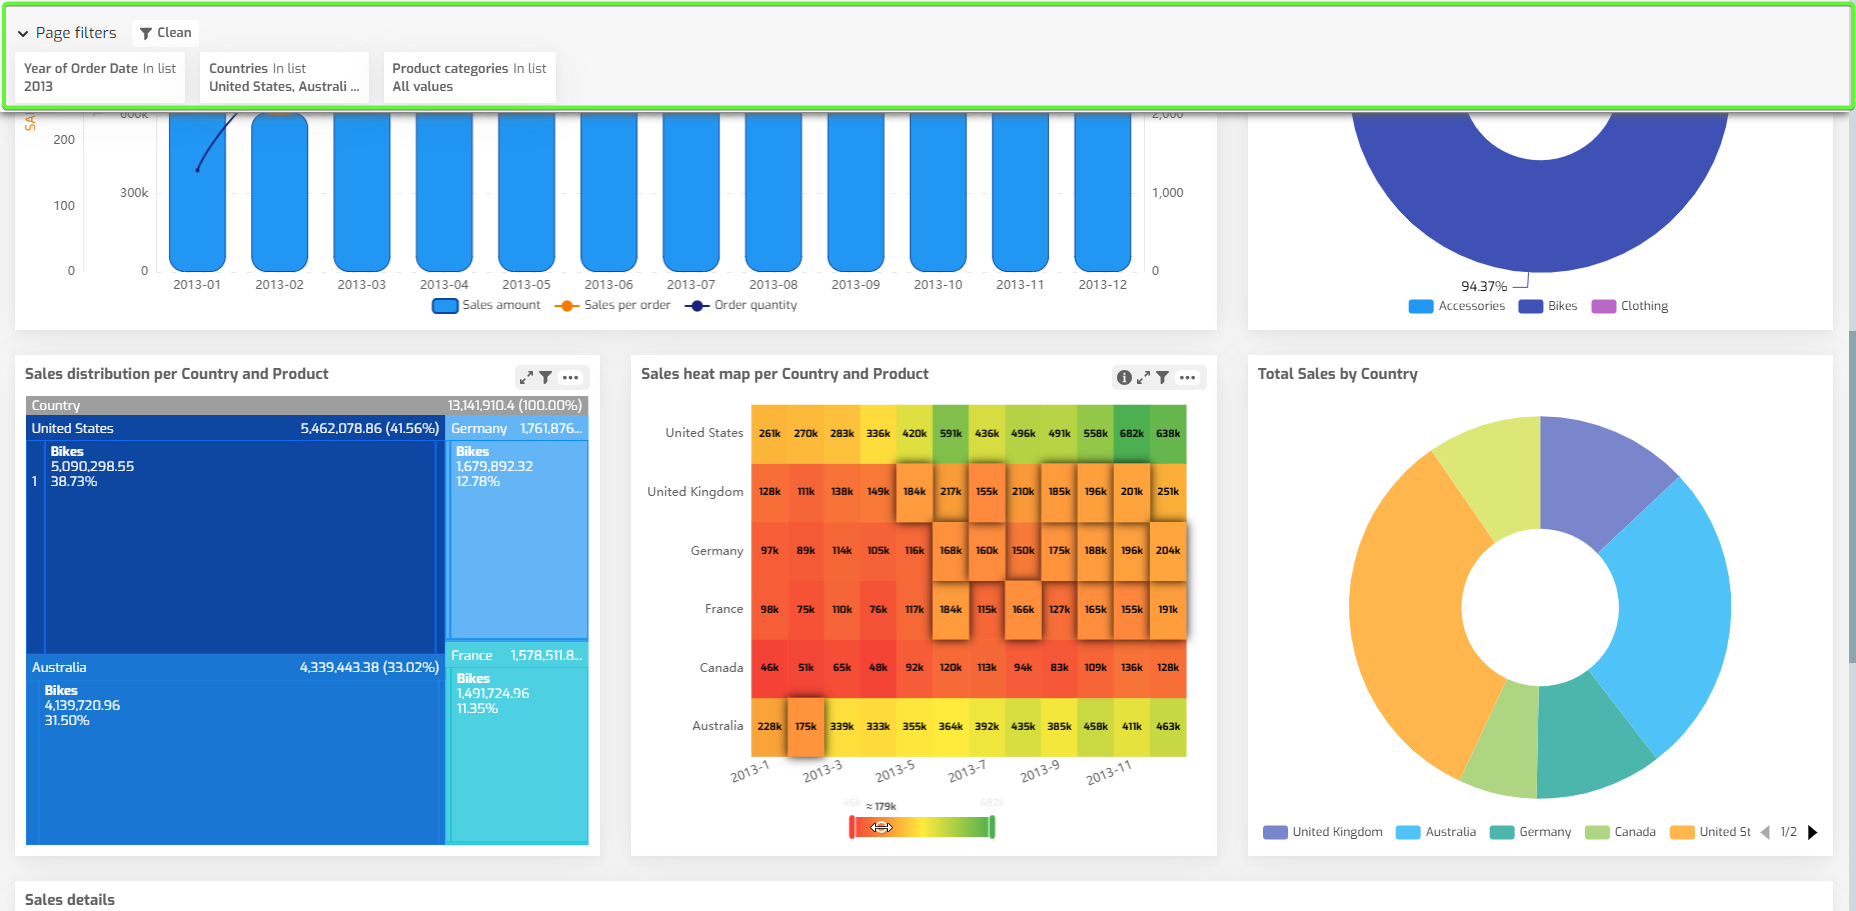
New option to set header and filter area to be fixed when scrolling. When you build pages or collections that have vertical scrolling, users may lose sight of the header with the title and description, and the filter area, which may force them to scroll up and down to interact with the filters and ask new questions to the data. Since this update, you can configure in the general options of pages and cards whether you want to keep the header on top and/or keep filters on top.
Improvements:
-
The loading time of content (Collections, Pages, Cards) has been significantly improved by optimizing the metadata required in each case. The effect is that Biuwer displays content and data even faster than in previous versions, especially in cases where there are dozens of cards involved, with a multitude of filters and interactive elements configured.
-
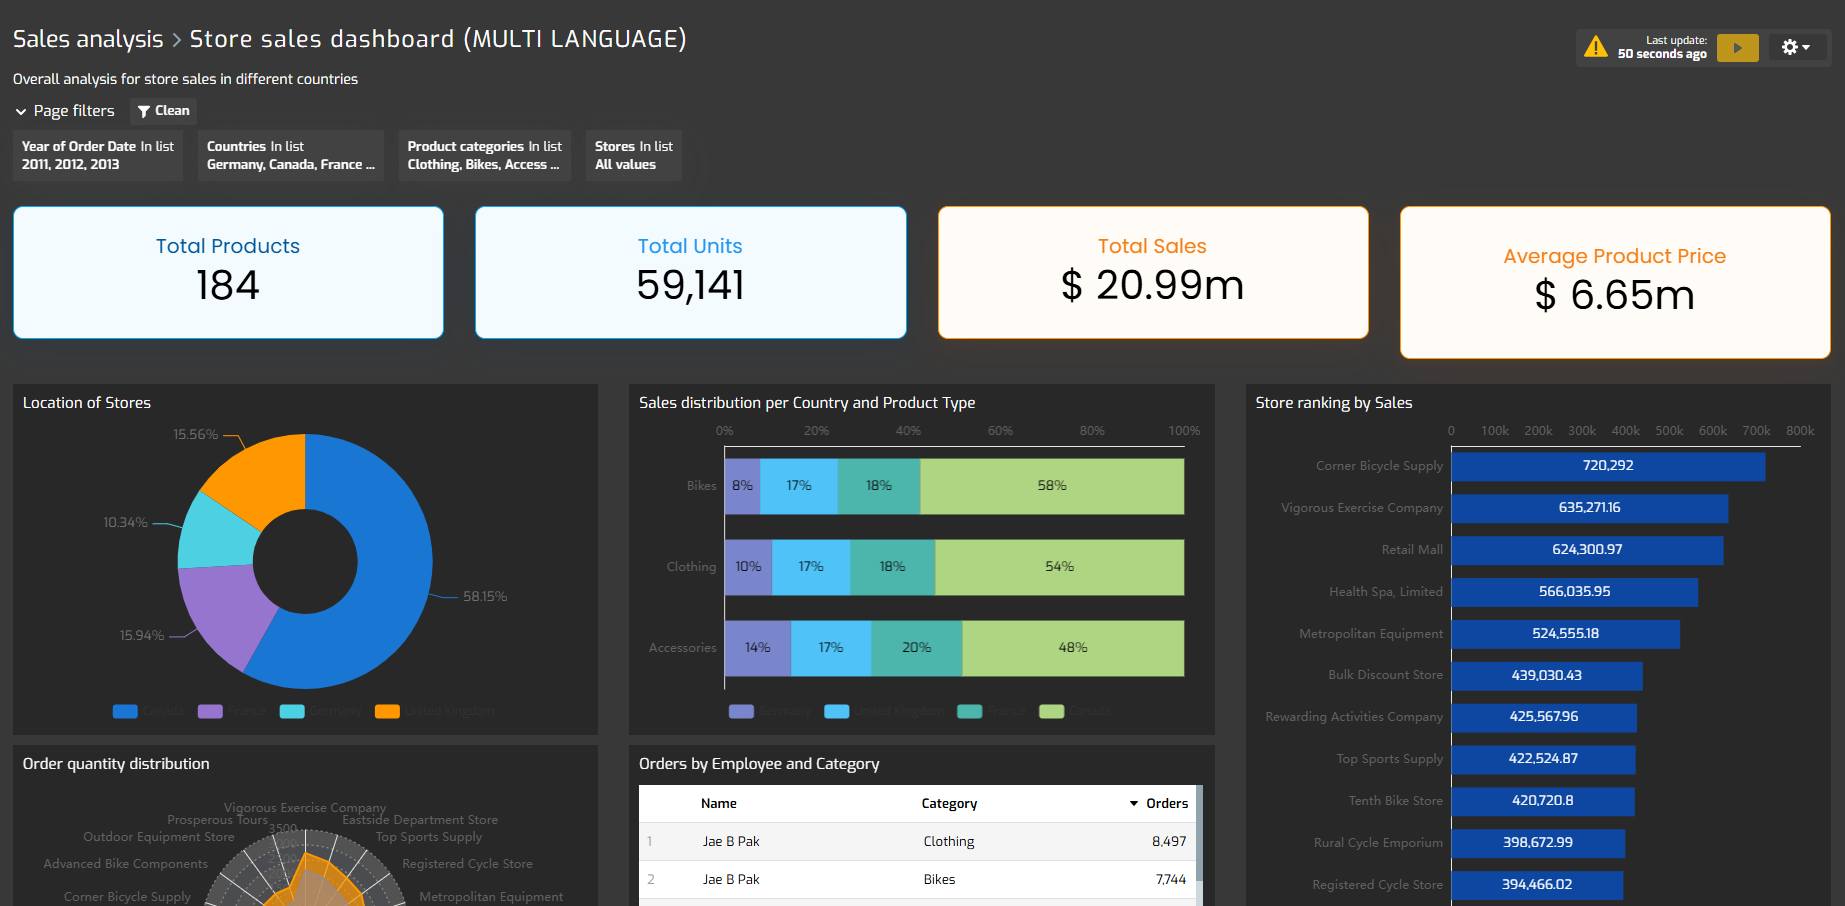
More modular and configurable theme application. Since the launch of Themes in Biuwer this year, we have continued to evolve the system to allow with this update an improved application to various needs and use cases. Since this update, themes applied at different levels (Collections, Pages, Cards) are applied in a completely individualized way and with total versatility, which allows you to configure more personalized and diverse visual designs in your embedded data applications.
-
The preview of Datasets has been improved by not including the Data Policies that may apply to the editor/administrator user who is currently viewing the data.
-
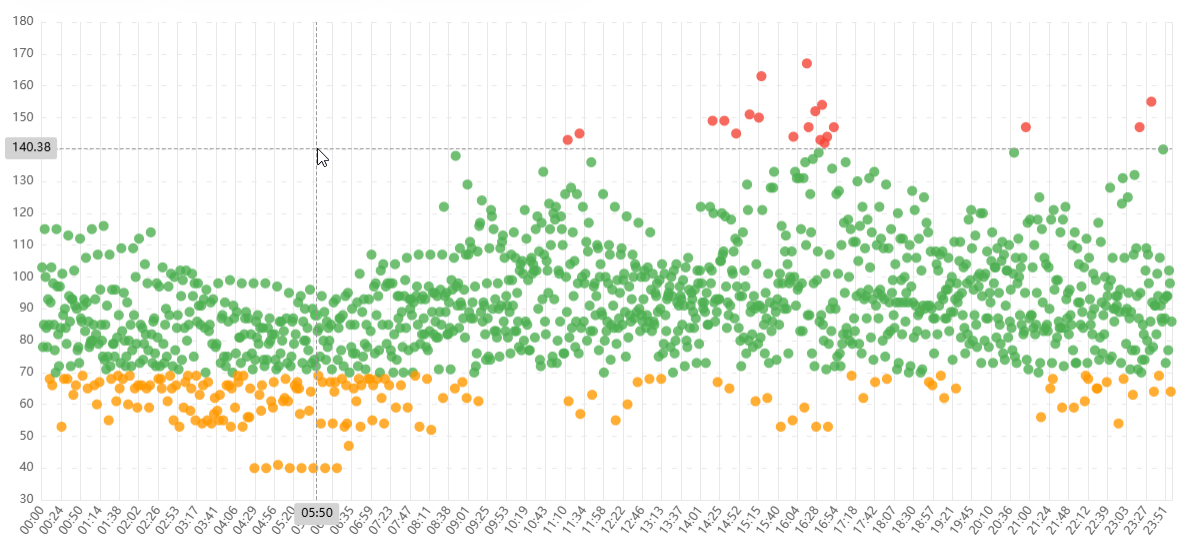
The ability to configure the size of points in scatter plots has been added, to allow for cases with hundreds or thousands of points and clearer visualization.
-
A pre-load element has been included in pages, to show the user that the content is loading for cases with many cards and with a lot of calculation complexity configured.
-
The automatic logout behavior has been improved, which until now Biuwer had been doing too early, without taking into account the user's activity period. Since this update, session times have been extended taking into account the time that the user is active on the platform.
Bug fixes:
-
Fixed the configuration for empty text filters.
-
Fixed a reported error when configuring multiple layers in map cards.
-
Fixed a problem detected in map card legends, with multi-language configured.
-
Fixed a reported error for the jump, maximum and minimum settings in chart axes of any type.
-
The order in which legends and tooltips appear in stacked bar charts has been unified.
-
Fixed the reported problem with the “Where is used” functionality.
-
Adjusted the week format when exporting to Excel.
-
Fixed a reported error with IS NULL and IS NOT NULL operators in card queries.
-
Other minor fixes.


