Key Features
From first dashboard to full experience, features that scale with you
iFrame - Web Component (SDK) - API
Flexible embedding options
Choose the integration path that fits your stack. Embed dashboards with iFrame or Web Component, and automate provisioning & updates via API without heavy releases.
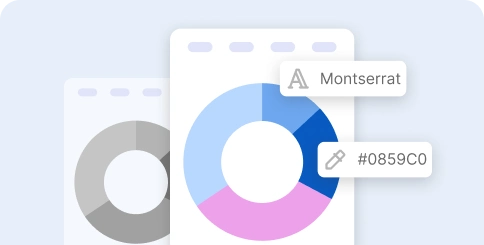
Branding that feels native
Deep theming & layout
Match your product’s look & feel with color palettes, typography, sizes, spacing and component styles, so analytics blends seamlessly into your UI.
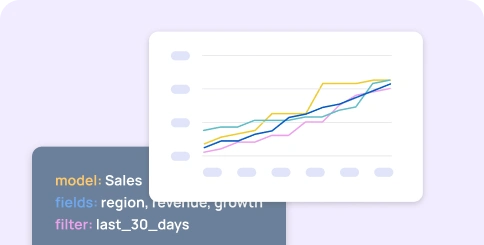
From idea to dashboard, fast
No-code content editor
Build and iterate dashboards visually with drag-and-drop, templates and interactive filters. Ship value in days, not months.

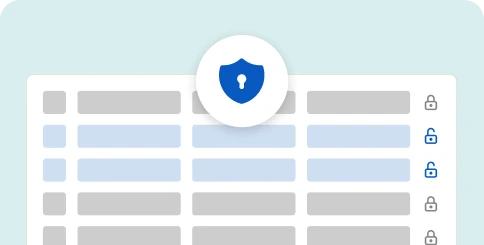
RBAC - OLS - RLS
Access control & data isolation
Keep each customer’s data strictly scoped with roles (RBAC) and object/row-level security (OLS / RLS), plus audit trails and tokenized embeds for safe external access.
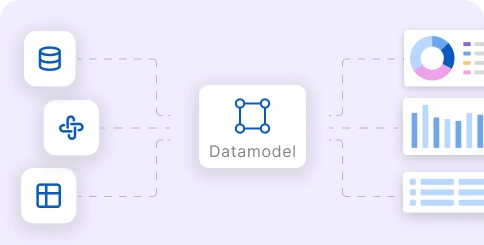
Connections - Datasets - Data Models
Data center: modeling & sources
Centralize and organize data: connect sources, manage datasets, and create models that define fields and relationships for clearer visualizations.
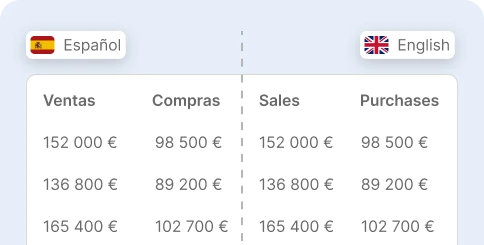
Languages, formats & labels
Localization & i18n
Offer analytics in your users’ language. Configure labels, date/number formats and text strings to match each locale or language.