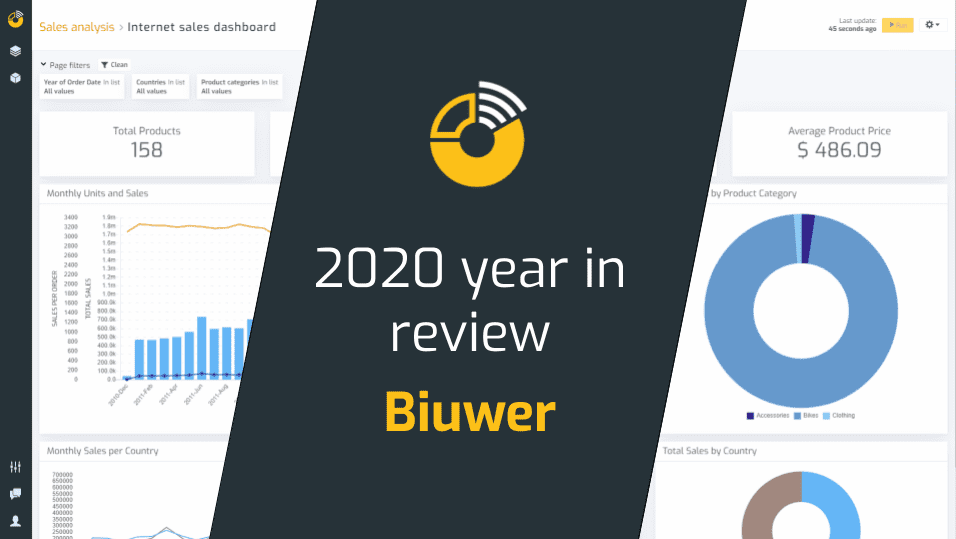
Biuwer 2020 Year in Review
2020 is already marked by everyone as the year of the global COVID-19 pandemic, which has not been easy for anyone. At Biuwer we have continued to work with our clients and continually improve the product. The new map cards stand out the most among all the new features, but we are not forgetting the near future and we are preparing new tools to make data management and analysis even easier.
This year that is about to end will be marked globally as a fateful year due to the coronavirus / COVID-19 pandemic. At the business level there will be sectors that have been affected more than others, just as there will be companies that have been benefited.
For Biuwer, this has been no different. The world of data analytics at the business level is at the end of the digitization chain, so in times of crisis there is a tendency to stop investment in everything that is not essential for the business.
From our point of view we believe that a Data Analytics platform allows you to make decisions based on data, so it should never be outside the core of your business.
We at Biuwer have bet on innovation and product development in this year 2020. As you can see from our product updates, we haven't exactly stood still. Despite being a relatively small team, we have achieved development-level objectives that even we have surprised ourselves when we made this summary.
Main new features in 2020
As a summary, these are the main functionalities that we have incorporated into Biuwer, the first data visualization platform developed entirely in Spain.
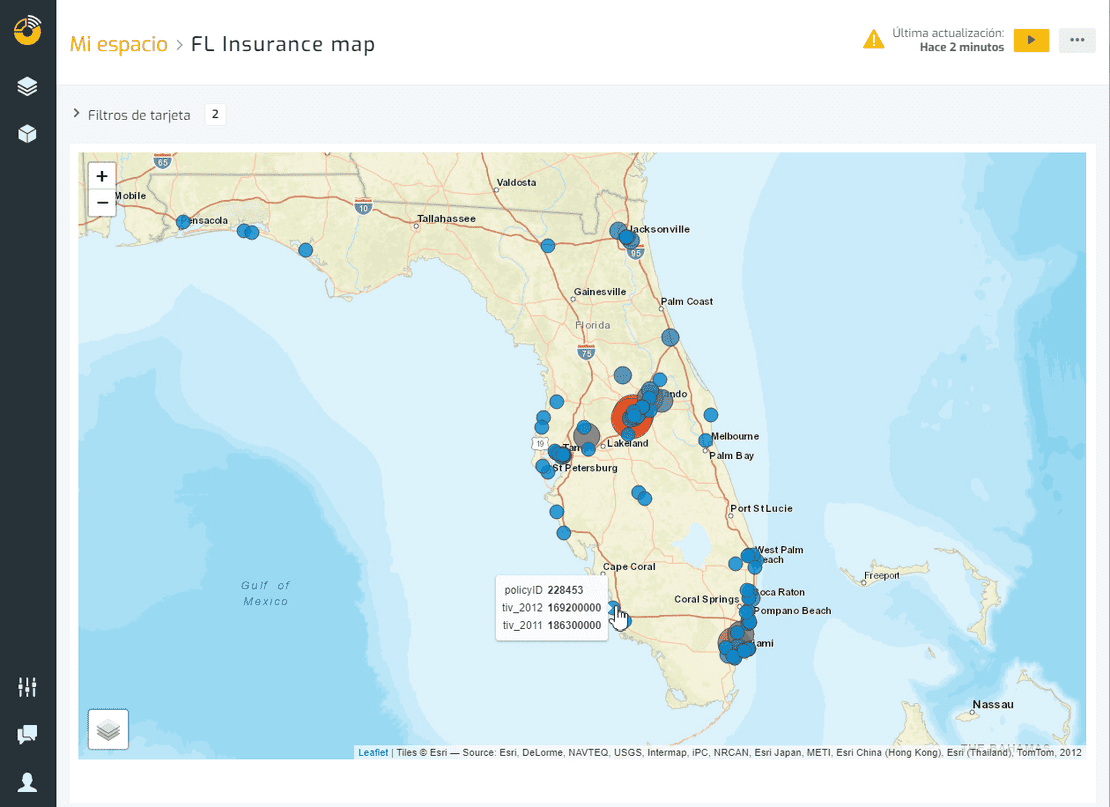
Biuwer Maps
We have included maps as a new type of visualization. Through Biuwer Maps you will have the ability to analyze any set of geo positioned data using maps. The map cards allow you to use the catalog of maps offered in Biuwer by default, but they are also customizable, so it is possible for each organization to have its own maps, with their own meaning, their own coding, etc.
The types of maps available in Biuwer are:
- Symbols Maps
- Choropleth Maps
New data center
We have completely redesigned the data center. The user interface has been completely modified offering a significant improvement at the user experience level.
New types of data connectors have been included. Now you can create dashboards and visualizations from the most used databases globally.
Embedded Analytics
We have improved the system that allows us to share pages and cards externally to Biuwer, called embedded analytics, allowing validity intervals with a new user interface.
Query and data processing optimizations
We have significantly improved Biuwer's query engine. The increase in the speed of query generation has been close to 50%, so Biuwer clients enjoy data visualizations with an incredibly fast data refresh (the final speed will depend on the database system you are connected to in each case).
The goal is to offer a fast and intuitive tool to use on a daily basis.
New administration area
We have completely redesigned the administration area, making it easier for Biuwer clients to better manage their organization, including general information, subscription and billing settings, security settings and access control, etc.
Data importer
The configuration options in the data importer through CSV or Excel files to Biuwer have been optimized and significantly expanded.
Other functionalities
You can check our product updates page to see all the details regarding new functionalities and improvements that we constantly incorporate in Biuwer.
What are we working on and what is expected in our closest roadmap?
Biuwer's roadmap is very ambitious and includes many of the suggestions and new functionalities that the clients themselves propose. We are continuously working on the 10 trends in the data analytics tools of the future.
During 2021 we hope to make available to Biuwer users, in addition to minor improvements and other adjustments, the following major features.
API Analytics
It is a Data Analysis system based on APIs that allows to analyze the data available in SaaS applications, in the form of Dashboards or interactive Dashboards created automatically, so that they are easy to view and use by end users, and all this, with a minimal configuration by the user.
With API Analytics we will include as data sources the applications most used by many users, such as:
- Google Analytics
- Hubspot
- Stripe
- Shopify
- Sage
- Holded
- Etc.
Once the connections and the recurrence of automatic data reading have been configured, you will have your data from external applications in Biuwer to be able to analyze them as you want and get the most out of them.
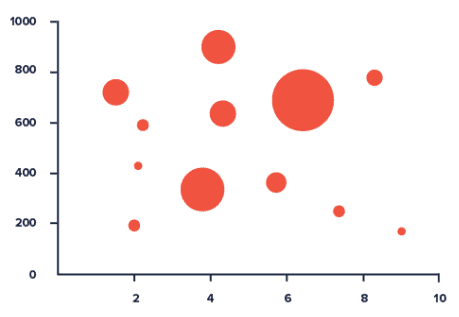
New types of visualizations and charts
Biuwer currently has more than 12 types of charts, each of which with multiple variants and configuration possibilities. However, we are working on expanding the catalog of visualizations and charts to include, among others, the following:
- Scatter and Bubble Charts, to allow analyzing correlations and dispersions between variables.
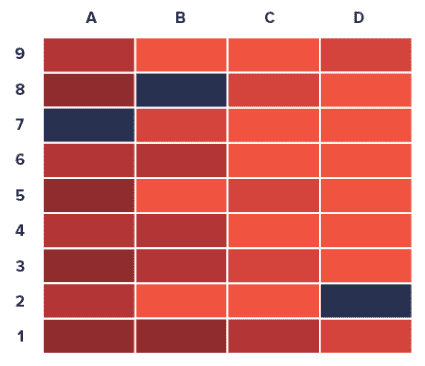
- Heat Charts, to allow assigning color scales to view patterns and trends at a glance.
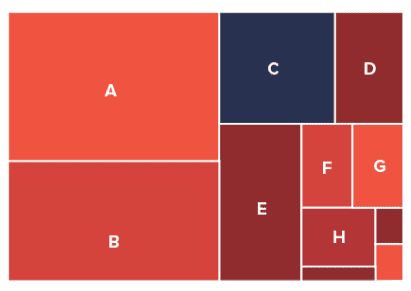
- Treemap Charts, perfect for displaying large amounts of hierarchically structured data (tree structure), divided into rectangles that are assigned a size and order based on a quantitative variable.
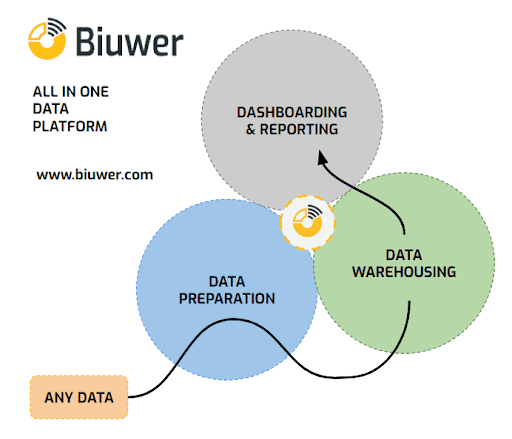
Biuwer Data Prep
We have been working at Biuwer for years on a 100% cloud data integration and processing system, which already allows a selected set of clients to have a very versatile set of tools available on the same platform when it comes to obtaining, cleaning, preparing and integrating your data. We expect Biuwer Data Prep to be publicly and generally available to users in 2021. Very briefly, with Biuwer Data Prep you can:
- Connect and extract data from various data sources.
- Apply any business logic to the data, through data workflows completely customizable to your needs.
- Dump the results in any data destination, usually data warehouses (DWH).
The objective with this approach is to provide Biuwer with the data preparation and data storage modules, to offer an all-in-one platform, in terms of data management and analysis: