Businesses move in an environment that is fraught with data that is often difficult to interpret. Dashboards are considered an essential tool in business management as they make all information meaningful.
After a period in which technologies such as Business Intelligence and Big Data were considered optional for companies, we now have a scenario in which more and more companies cannot conceive of their daily management without these tools.
In the 21st century we live in times of high competition, globalized markets and with thousands of tools, sensors or people generating data continuously and in great volume, which become our best ally to make intelligent decisions every day, which make our organization grow or overcome times of crisis.
Any company that stays behind in this area and does not make use of the endless possibilities offered by the data, already shows important weaknesses compared to its competitors, because by not having all the information offered by the data, it is letting go great opportunities materialized in earning time and money.
These are some examples of Business Dashboards commonly used in companies:
- Sales Dashboard
- Purchasing Dashboard and Supplier Analysis
- Customer Analysis and degree of satisfaction
- Financial Dashboard
- Human Resources Dashboard
- Marketing Dashboard
- Investor Relations Dashboard (startups and funded companies)
- Situation and state of the competition
What is a Dashboard?
We can define a Dashboard as the interactive graphic representation that displays the Key Performance Indicators (KPIs) established by the company, which allows to make decisions that result in the achievement of the set objectives.
Data displayed on a Dashboard can come from multiple data sources and be automatically updated by data integration processes. The idea is to have a global view of the company starting with a bird's eye view that summarizes the large numbers in different areas, so that you can drill down into the data to look at the detail and act quickly.
Much of the success of a Dashboard is in asking good questions. That is, what does this Dashboard pretend to solve? By asking the right questions, KPIs will automatically emerge, which are the numerical indicators to be measured. At the same time, to give life to each KPI, it is necessary to have an available data source from which it is fed and to give it a graphic representation through a correct data visualization.
Spreadsheet or modern Business Intelligence tools?
It is a fact that all companies use spreadsheets for their first steps in information gathering and data visualization tasks. Making a Dashboard with tools like Excel is possible but we do not recommend it for several reasons:
- As we have said, the power of a modern Dashboard, also known as a data panel, is in being able to connect at the same time to different data sources and other web services, to monitor updated metrics in real time. Doing this with a spreadsheet is almost unfeasible.
- Updating data in a spreadsheet is usually manual, that is, if you want to do a daily analysis, you will have to manually enter the data for each day, something that does not make sense having tools that automate data extraction, processing and secure storage, before being analyzed.
- Information lives in silos. Each spreadsheet can be considered as an island, isolated from the rest of the world. We live in a hyperconnected world, and different people or groups of users have to access information safely, from anywhere, at any time. This is possible with modern data analysis tools.
What are the benefits of daily management using Dashboards
The Data Driven Growth movement is based on working every day with the important data, to constantly improve. Precisely the first contact with the data is with Dashboards in which we find the summary and the most important trends of our data. These are some of the benefits:
- Decision-making. By viewing the data summarized in charts and numerical indicators, we can detect any deviation immediately and act accordingly. To have more detail, we can drill-down from the Dashboard charts to detailed reports with the needed breakdown that give us all the information to act accurately.
- Effective and distortion free communication. Organizational silos minimize productivity and hinder innovation. If we have a system of Dashboards, with automatically updated data and all the people with capacity of decision in the company have access to them, we get that the information arrives quickly to its recipients and without intermediaries. This facilitates collaborative work around the data and coordinated decision making.
- Updated data. The Dashboard must be updated in real time, as data evolve very quickly. For this it is useful to have analytical tools that automatically collect the information, shape it and present it in a Dashboard.
- Availability 24 hours a day, 7 days a week, from anywhere in the world. Modern Business Intelligence platforms such as Biuwer are based on a secure deployment on the cloud, which makes it possible for people in the company to work at any time, wherever they are with an internet connection. This is important in recent times when remote working is growing, and for companies with multiple locations or have presence in several countries.
- Customization. Dashboards are usually presented with a dynamic filter system, which each user can customize to make a specific interactive analysis. That is, the same panel can show different data depending on the filter configuration applied by each user. In addition, modern BI tools allow you to duplicate Dashboards quickly and modify the chart or KPIs that are displayed.
- Data comparison is quick and easy. Besides being able to show KPIs in the form of time evolution, it is very common to make comparisons between different periods (previous year, previous quarter, previous month, same period of last year, etc.) in a numerical way and even to see total values as a percentage value. Analyzing trends visually is a powerful tool for making decisions.
How to build a Dashboard using Biuwer
Professional tools such as Biuwer make it possible for everyone to get the most out of data without prior technical knowledge, thus enabling the creation of reports and Dashboards for quick and easy data analysis.
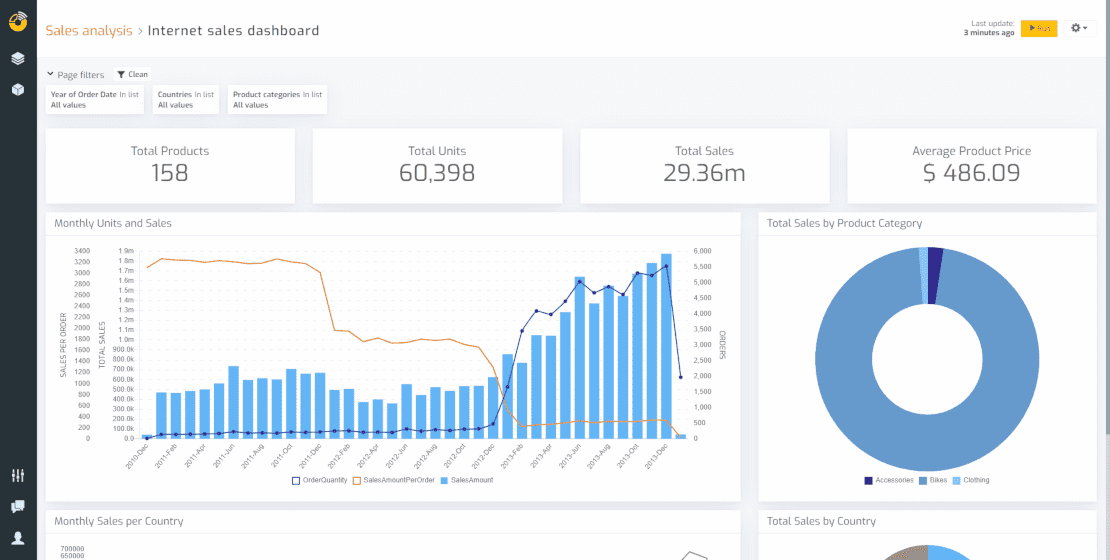
Let’s see how you can build a Dashboard using Biuwer like the one shown at the beginning of this article. In this example, a company is selling bicycles, both online and in physical store:
1. Knowing what I want to respond with the Dashboard
In this case, I am interested to know how the Internet channel sales are evolving. Previously, I will have to configure the connection to the database with the available information in Biuwer.
I have to define the right KPIs (Key Performance Indicators), for example:
- Total Products Sold
- Total units sold
- Total amount of sales
- Average sales amount
- Monthly evolution of units, amount of sales
- Sales distribution by product category
2. Take care of the design
The same information can be represented in multiple ways. We must select the correct charts and data visualizations to show the KPIs properly.
- Usually the total numerical values are better displayed using indicator type visualizations. In the case of Biuwer, these are “KPI cards”.
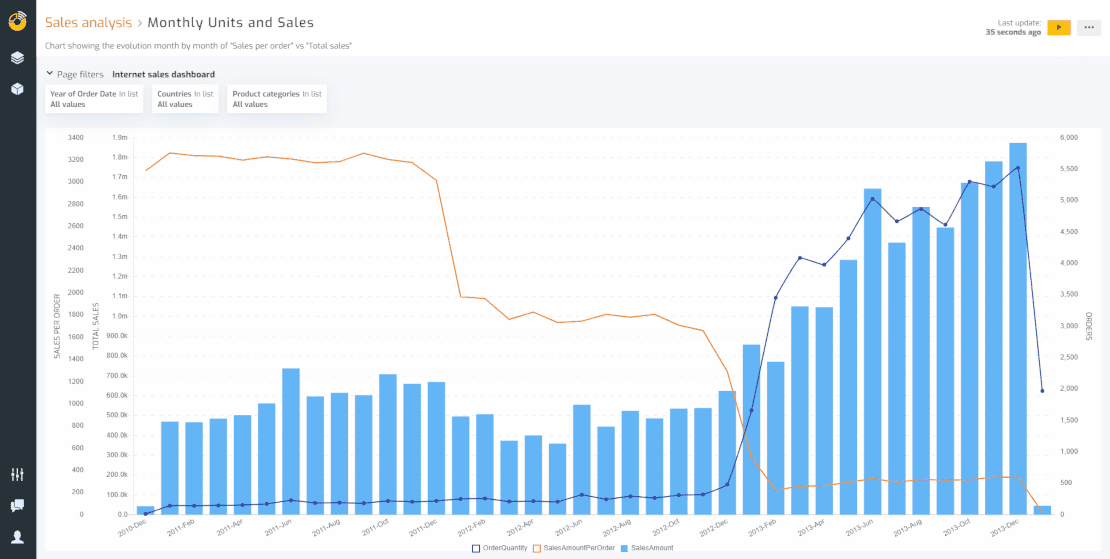
- Time evolutions usually look good using line and bar charts, with values for each period. It is important to use appropriate colors, with the necessary contrast, and to use as many axes as necessary to properly show the different orders of magnitude.
- The percentage distribution of a metric. When the different values to be displayed are not many, they can be properly viewed using pie or donut charts.
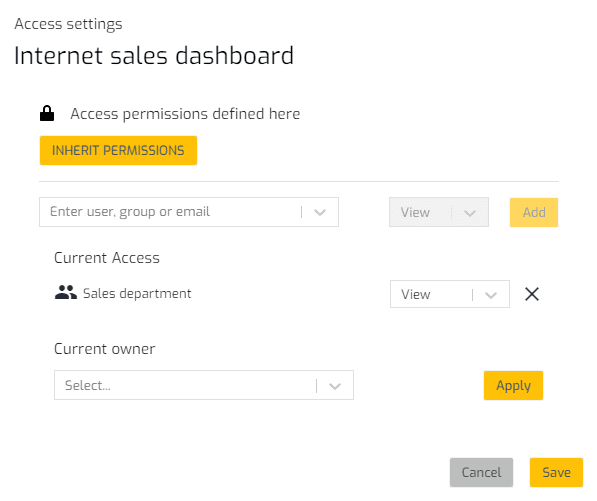
3. Communicate information to the right people
Using Biuwer it is easy to give access to a Dashboard to the people in the company who will need to make decisions with it. Use the page and card access settings to configure this:
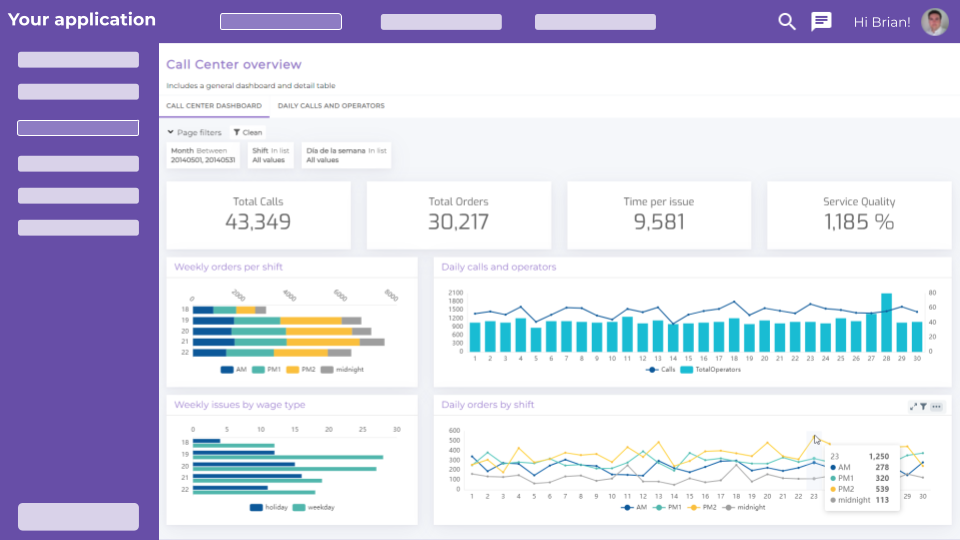
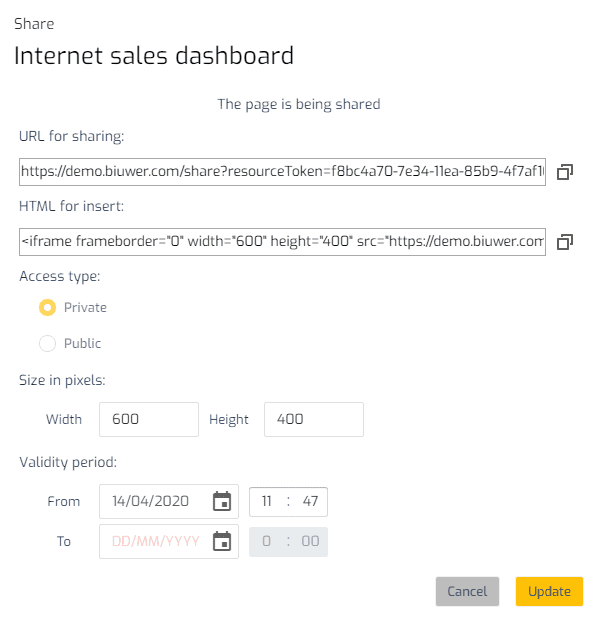
For those cases where it is required to use a Dashboard embedded in an external application outside Biuwer, it can be shared securely, using security tokens associated with users as if they were using Biuwer directly.
In short
Considering all of the above, Dashboards are today a fundamental tool to drive Data Driven Growth, providing the organization's members with the accurate information to achieve business objectives.
Taking advantage of the existence of platforms such as Biuwer, any company, regardless of its sector, can start using Dashboards, thus guaranteeing improvements in the company, for which it will not be necessary to be a data expert or even have previous technical knowledge.
If you are interested in knowing more details, do not hesitate to contact us and we will help you to improve the performance of your company.