March 31, 2023
March 2023
New functionalities:
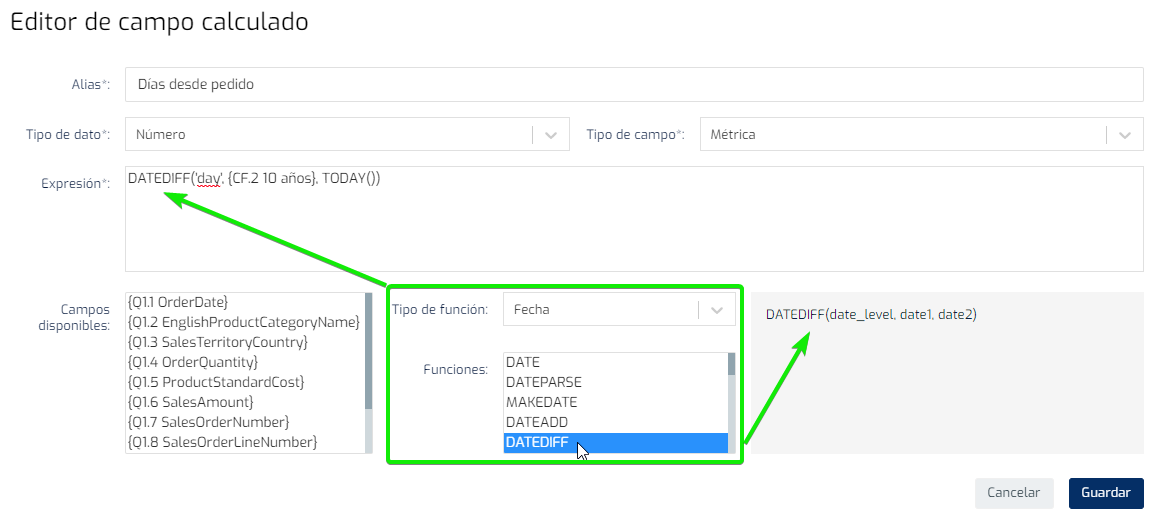
- Date functions are now available in Calculated Fields. The Data Card Editor continues to be improved, now including a set of functions to operate with dates in the expressions of the card Calculated Fields. The possible combinations and options are many using the new functions: DATE, DATEPARSE, MAKEDATE, DATEADD, DATEDIFF, DATEDIFF, DATENAME, DATEPART, DATETRUNC, YEAR, QUARTER, MONTH, WEEK, WEEK, DAY, ISOYEAR, ISOWEEK, TODAY, ISDATE. In addition, the functions MAX, MIN can also be used with date fields, to obtain the corresponding maximum and minimum dates. Keep in remind that you can also use the previously released functions for automatic comparison of metric fields in previous periods: PREV_YEAR, PREV_QUARTER, PREV_MONTH, PREV_WEEK, PREV_DATE. More information at Biuwer Docs.

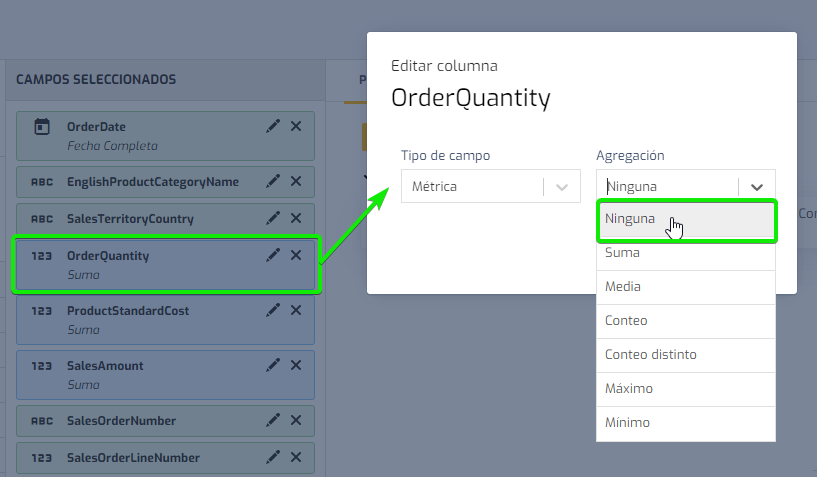
- NONE aggregation possibility on METRIC fields. Biuwer's automatic query engine until now always required an aggregation function for a metric field. If you know SQL it is the usual SUM, COUNT, AVG that is usually used in your data queries. However, there are cases where you want to not aggregate, i.e. get row by row data without aggregating. For example, if you want to visualize a scatter or bubble chart you may not want to aggregate the metric fields involved. This and other use cases are possible from now on with Biuwer.

Improvements:
- Several improvements have been introduced in the Biuwer Public API. Since this update you can now manage all the security settings, both in the access to the content (Shared Spaces, Pages, Cards, Collections) and to the data itself, through the Data Policies. In other words, the Biuwer API now allows you to manage Data Policies, Spaces, Pages, Cards, Collections objects.
- The Google Ads connector has been updated to the latest version of the API provided by Google.
- We have improved error handling, including visual elements when errors occur. This makes it easier for users to contact support and at the same time we can solve any issues more quickly.
- We have improved Scatter / Bubble plots, with support for aggregated or unaggregated metrics on either the X or Y axis.
Bug fixes:
- Fixed the problem that caused that totals (SUM, COUNT, AVG, MIN, MAX...) defined in vertical tables on metric columns obtained from dimension fields, did not work correctly.
- In charts, the legend is displayed correctly in "Right" and "Left" positions.
- Some details have been fixed in the funnel chart, such as displaying correctly the data label in percentage and the data sorting.
- Other minor fixes.


