March 2024
New functionalities:
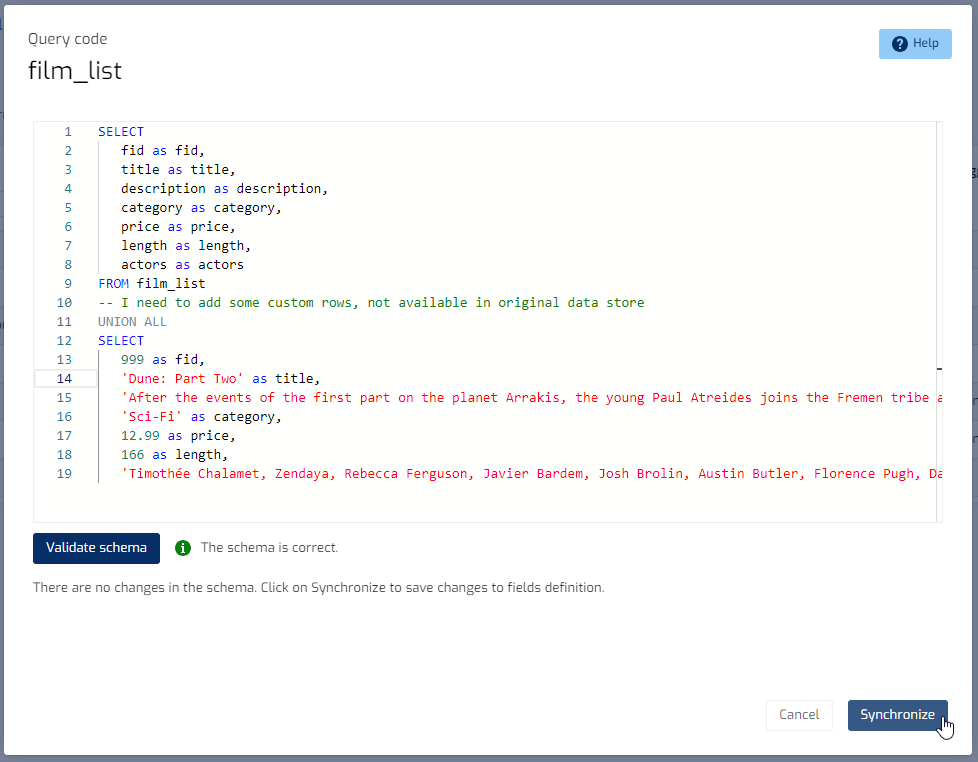
- Datasets defined as Views. Datasets in Biuwer are the starting point for the query engine to do its job and obtain data to display in visualizations. Until now, the definition of Datasets could be done manually (incorporating fields one by one) or using the Reverse Engineering utility, very useful to access the definition of tables and data views quickly and easily. However, there are cases in which to implement more complex data logic, it is required to code queries typically using SQL, which implement the necessary calculations, aggregations, and logic. Given this, a solution is to create views defined using SQL physically in the source database. There are cases in which this is not possible, for various reasons, and others in which the calculation logic may change. Since this update, views can now be defined in Biuwer, without having to touch the source database. The most interesting thing is that this allows a lot of flexibility, since a Dataset can be started without being a View and change to a View and evolve over time (and vice versa).
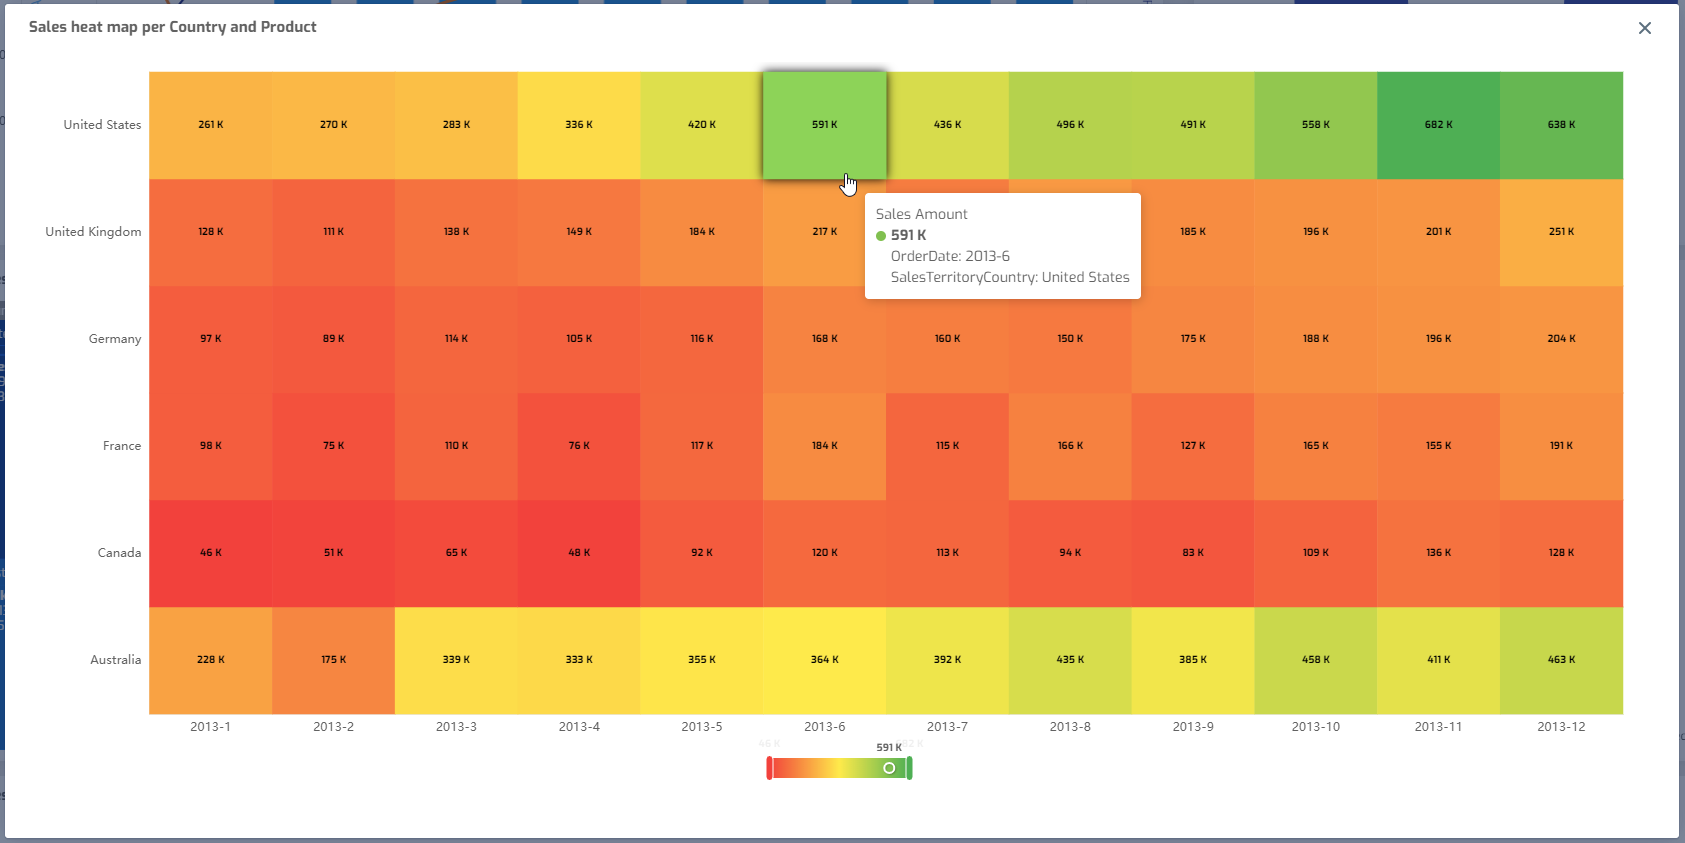
- New Heat Map chart. A heat map is a two-dimensional representation of data in which various values are represented by colors. A heat map provides an immediate visual summary of information on two axes, allowing users to quickly grasp the most important or relevant data points. Therefore, the heat map chart is one of the most useful and powerful data analysis tools in Business Intelligence. Provides a visualization function that presents multiple pieces of data in a way that makes immediate sense by assigning them a different color. This is why heat maps are suitable for visualizing large amounts of multidimensional data and can be used to identify groups of rows with similar values, as they are displayed as areas of similar color. You can use them with different color palettes as shown in the example below. The chart has a legend with gradient colors that interactively shows the current value and also allows you to interactively filter the values to be displayed on the graph.
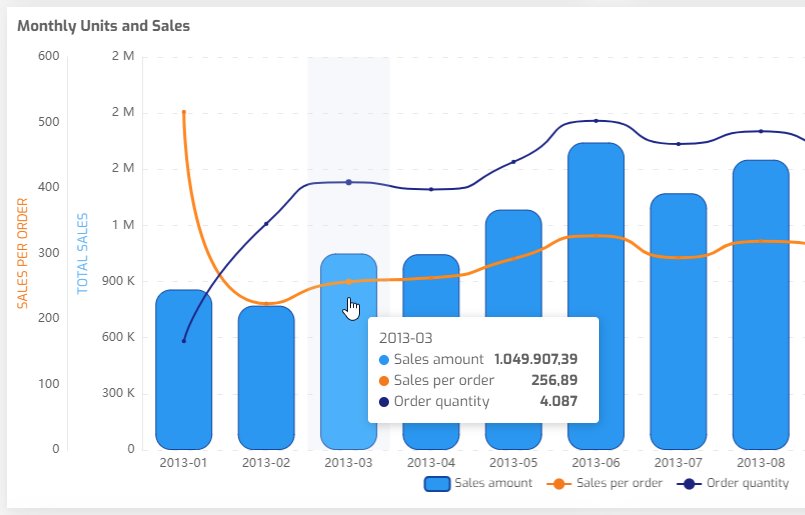
- Limit of values displayed on chart type cards. This new functionality is very interesting to be able to show the values in which we are interested, taking into account the ordering configured in the data. It is typically used in pie charts where it is interesting to have a limited number of values so that the user can understand the most prominent values and with the option of showing the rest of the values grouped into one value.

- Rounded corners on chart cards. Another novelty in the Biuwer charting system allows, from this update, to configure rounded corners, apply borders and different styles. This can be useful to display a more “round” style to your charts, for example bar charts or pie charts.
Improvements:
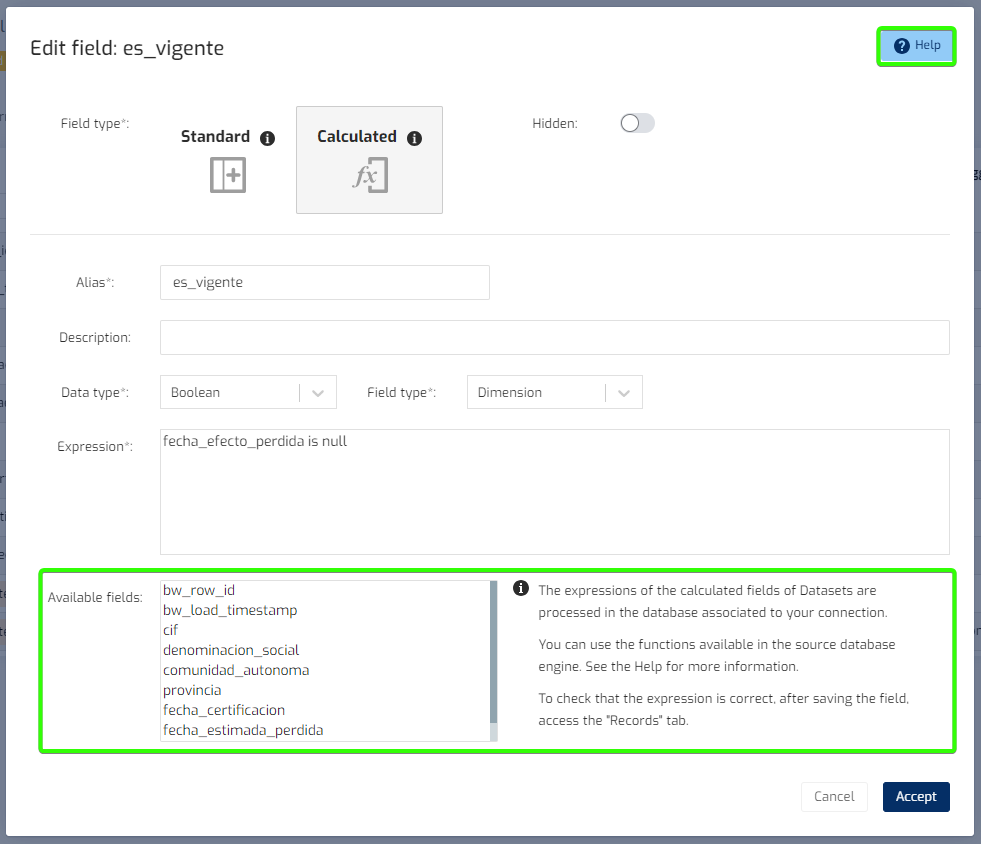
- Improvement in the Dataset calculated fields dialog, which includes an explanation of how it works and a link to the help page (Biuwer Docs). As indicated on the screen, the expressions of the Dataset calculated fields are processed in the database associated with their connection, for which you can use the functions available in the source database engine. That is, if, for example, the source database is PostgreSQL or Clickhouse, consult its official documentation to select the functions to include in the expression of the calculated field.
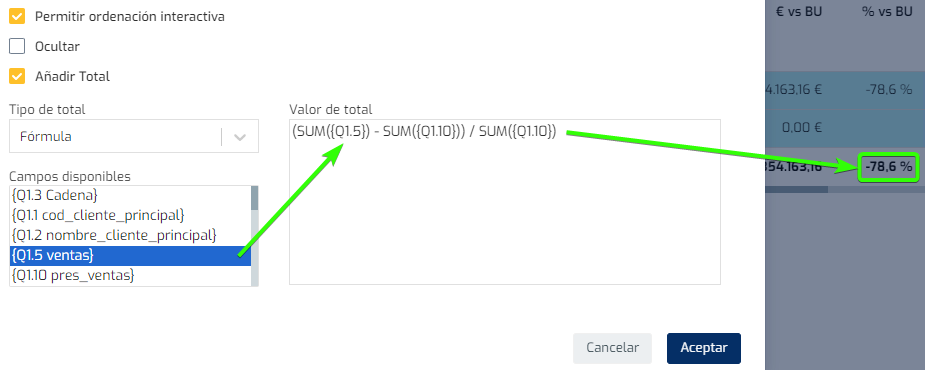
- The expressions of the formulas included in totals on cards have been homogenized, with the same syntax used by the card calculated fields.
-
Joins with calculated Dataset fields. The Biuwer query engine has been improved to be able to include calculated fields that you define in the datasets, in the fields involved in “joins”. In this way, regardless of the expression of the calculated field, the Biuwer query engine will include it using the unique identifier of the Dataset as an alias.
-
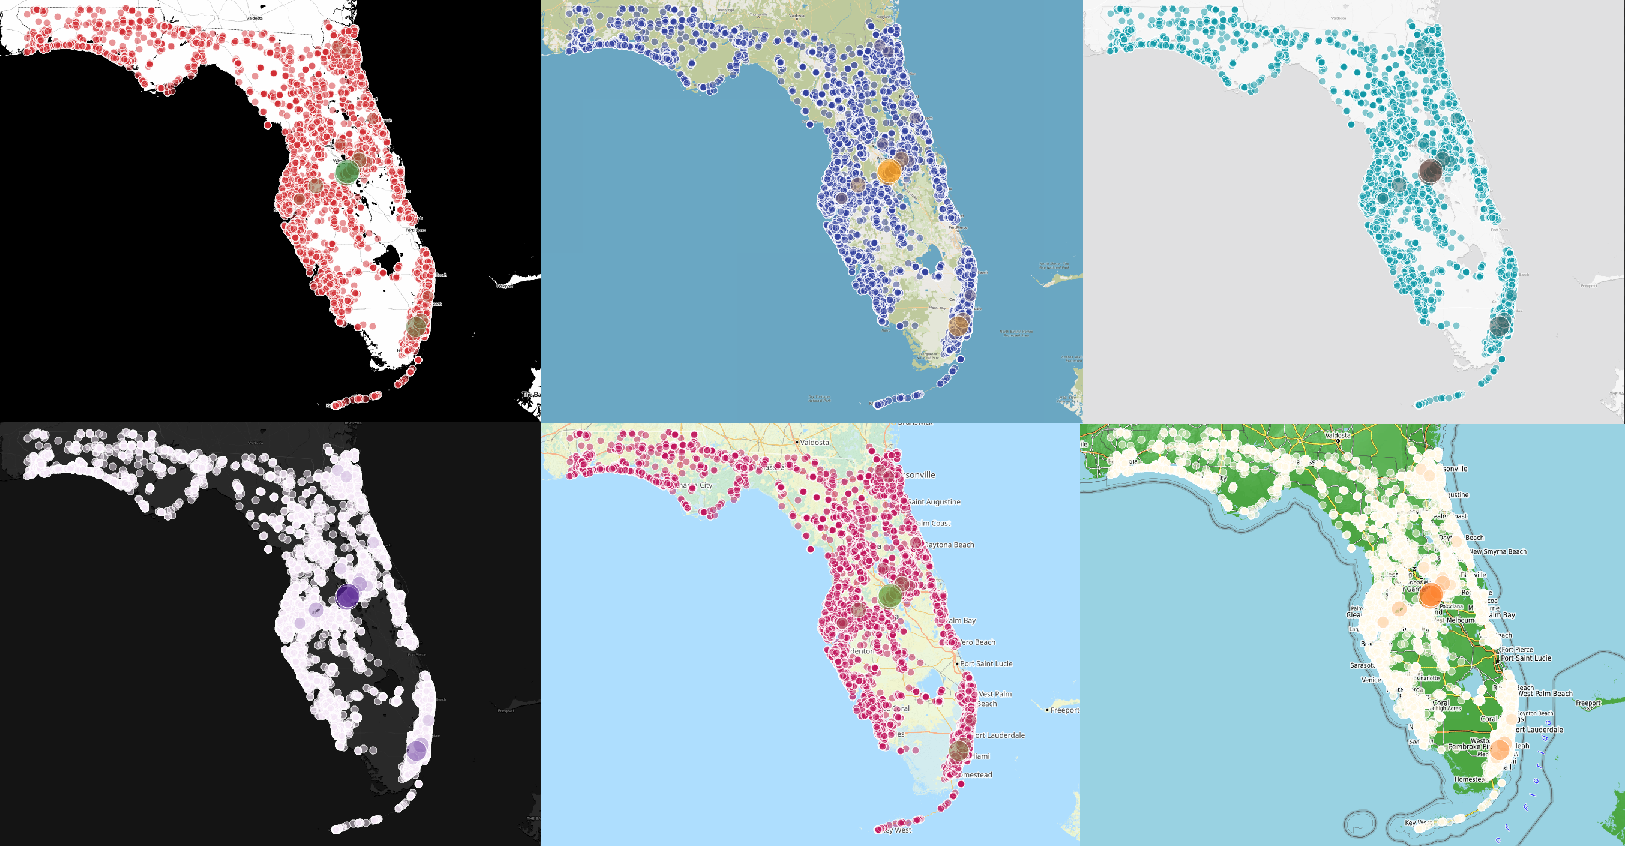
Map cards now include 7 new basemap types. When it comes to maps, a picture is worth a thousand words. We show an example of bubble maps on insured real estate properties in Florida, United States, taking six of the available variants as a base map. Imagination to adapt the result to your application!
-
The Row Limit Reached warning is configurable on each page or card. Until now, if a maximum number of records was configured and it was reached, a visual warning was always displayed to inform the user of this fact. Now you can configure whether or not to show this notice to your users. This notice will always be displayed in the Data Card Editor.
-
The list of shared spaces has been visually improved, so that when there are so many that a vertical scroll appears, the entire available space is used.
-
A warning has been included in case of query error in the data preview of a Dataset, in the Records tab. This error message is especially useful if you are working with views and calculated fields that may have some syntax errors that need to be resolved.
Bug fixes:
-
Solution to problem reported when clicking on column to sort in “Related Data” of the Card Editor, which did not show data.
-
Connection setting to Facebook Ads.
-
Adjustment in crosstab card, subtotals did not add up with NULL values involved.
-
Adjustment of color calculation in choropleth maps, to correctly differentiate between different buckets.
-
Other minor fixes.


