September 2024
New functionalities:
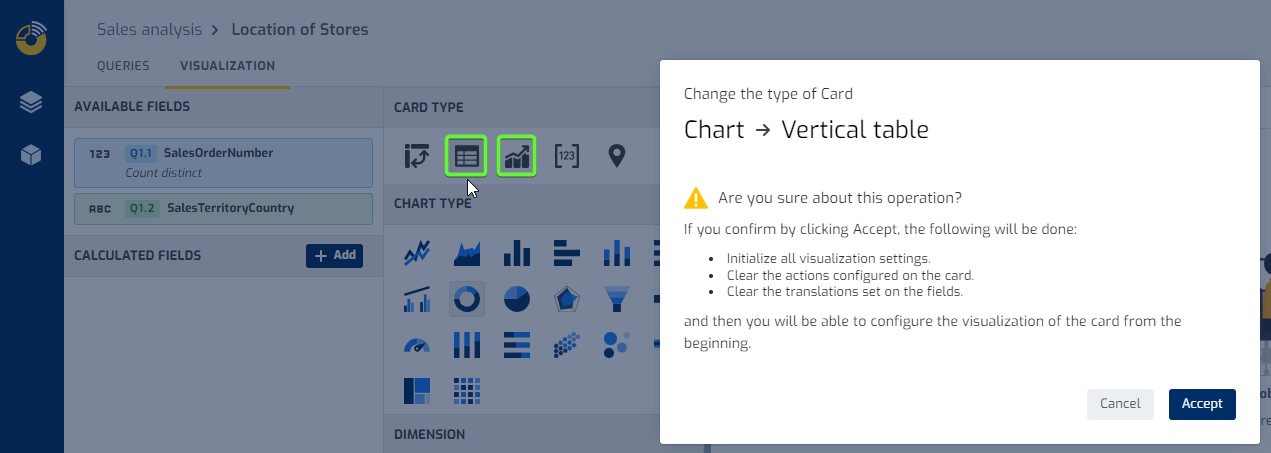
- Change of card type. Since this update, you can now change the type of card, during the creation or any modification you make on an existing card. For example, you can change a card whose display is a table to a KPI, or to a chart. This allows you to reuse or modify the original visualization approach, while maintaining all the data logic you have configured in the Queries tab, including the Card Filters. To change the card type simply select another type from the list in the “CARD TYPE” block of the Visualization tab and confirm the dialog with Accept. The pop-up dialog informs you of the changes that will be made to the card by changing its type.
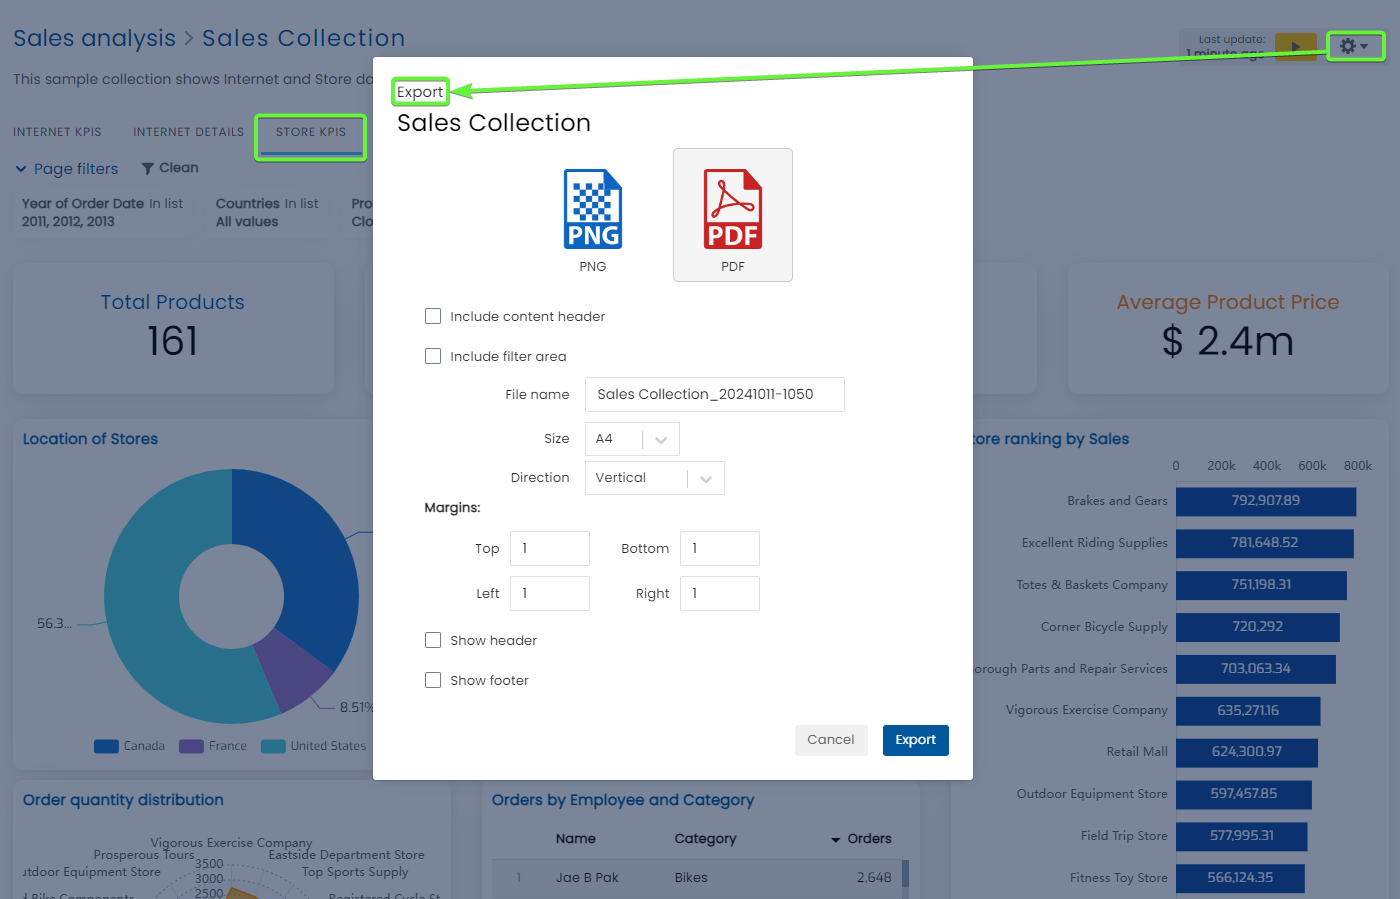
- Export in Collections. As with Pages and Cards, users can now download the active tab of any collection, in PDF or PNG formats. As in the case of pages, printing in these formats is done as a photograph of what the user sees on the screen, thus ensuring a correct visualization.
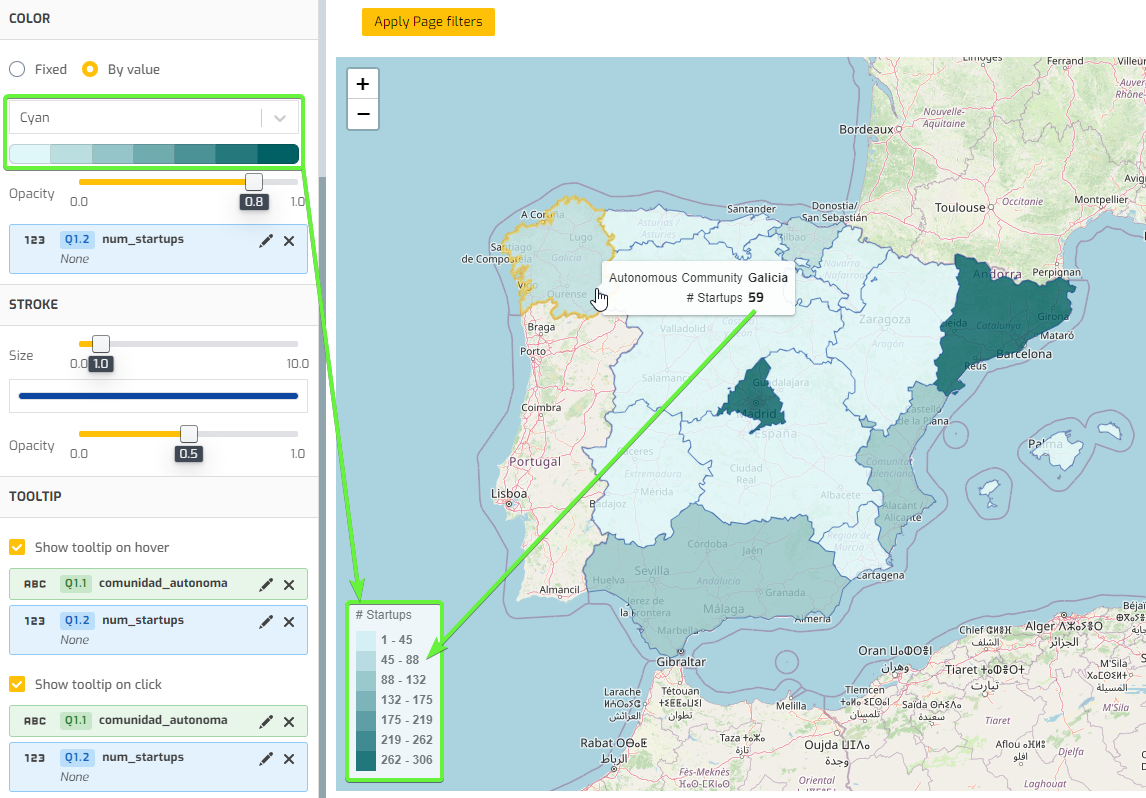
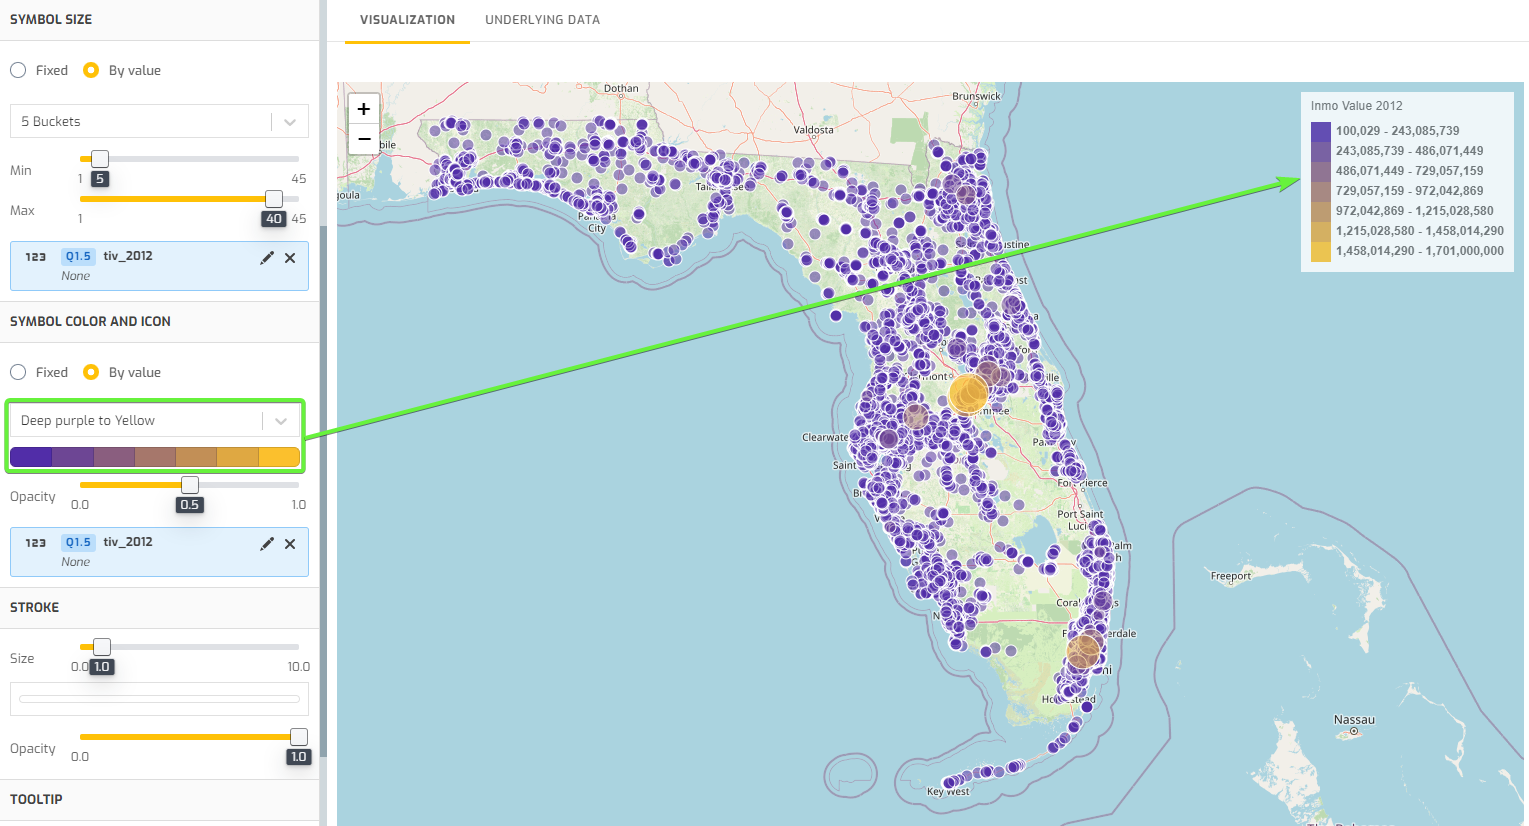
- Map legends. Particularly useful for the user, legends on Map cards allow you to report the different colors that are being displayed on the screen and the value ranges for each color. Legends are compatible with the various types of maps you can create in Biuwer, such as dot or bubble maps, and polygon or choropleth maps. The color ranges displayed and the number of colors depends on the color palettes you set up for each map. Here are two examples to show you how to customize the position or title displayed in the legend.
- New server infrastructure for Biuwer instances, together with the upgrade of internal services to their latest versions. With these interventions, with almost no loss of service and maintaining all connectivity with data sources, we estimate an increase in performance of around 20%, in terms of data panel loading speed. This is an important step in the automation of infrastructure to offer a better service and quality of response, increasingly faster, so that end users can have insights and valuable data in shorter times. Performance improvement is one of our main objectives, in parallel with the evolution of the platform.
Improvements:
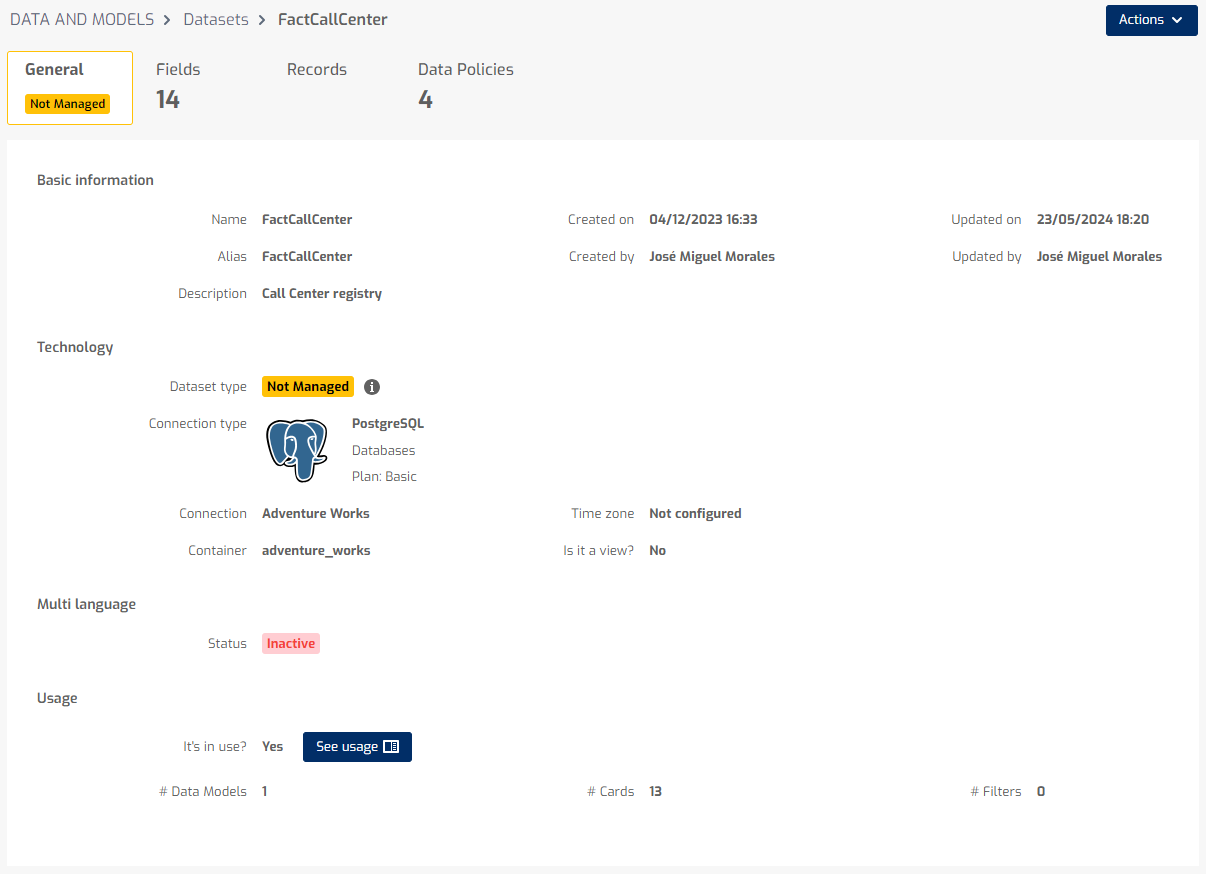
- We have improved the new General screen of Datasets in the Data Center. This way, we provide more essential information, including functionalities such as multi-language management or the usage of each Dataset. For each Dataset we show its basic information, the technology associated with the data source, information about string translations (multi-language) and information about the usage of the Dataset.
-
Performance optimization for displaying complex pages, with a large number of Cards and Filters. As we say, continuous performance improvement is vital at Biuwer and we have worked hard to minimize the load time of pages with complex content (e.g. 10 filters and 20 cards). We estimate that performance has been improved in some cases by more than 100% over previous load times.
-
Performance improvement for processing large amounts of data on screen. This improvement is an example of joint work with one of the accounts, which requires displaying tables of up to 1 million records and up to 30 columns. Obviously the volume of data to be processed is quite high and we have improved performance for these cases.
-
The Google Ads API version has been updated to the latest version 17.
-
Support has been included to get Materialized Views in Reverse Engineering, inside the Data Center. Until now only Tables and Views that have a SQL compatible database were displayed, and from now on you can add to Biuwer the necessary metadata to query your Materialized Views.
Bug fixes:
-
Fixed the reported error that prevented closing the filter configuration dialog in the Dataset Data Policies, for some specific cases.
-
Fixed the problem of displaying some base maps, in Map Cards, that did not work correctly. Base maps are the geographic layers that serve as background in your maps, on which the layers with your data are superimposed.
-
We have fixed some connection problems in SSH tunnel connections.
-
Fixed reported bug when creating a Rich Text Card.
-
Fixed the reported bug in the totals formulas in Table Cards, which did not work correctly in some cases using Card Calculated Fields.
-
Other minor fixes.


