TL;DR (Summary)
- A data portal is a website for sharing dashboards and insights with third parties. It can be public (no login, content exposed) or private (login page and access by entity / permissions).
- You want a data portal if you share recurring reporting with customers / partners / franchises and need white labeling + security (each entity only sees its own data).
- If analytics must feel native inside your product, embedded analytics is usually a better fit. If it’s a one-off report, exporting and/or scheduled sending is typically enough.
- If you don’t want to build it custom, a No-Code platform like Biuwer lets you launch a white-labeled portal with access control from the UI and evolve it quickly.
What Is a Data Portal?
Practical definition
A data portal is a website or front-end (public or private) designed to show data to third parties, customers, partners, franchises, branches, departments, or any “entity” that needs to see its KPIs clearly and securely, where:

- There is navigation (sections/menus) and a user-oriented “home.”
- It displays analytical content (dashboards, tables, insights, exports).
- In private scenarios, there is access control (roles/permissions) and typically multi-tenant behavior (each entity sees only its data).
- It is presented with your own branding (logo, color palette, etc.) and even with a custom domain such as data-portal.mydomain.com
In short: it’s the “productized” way to share data with third parties.
What a Data Portal is NOT
- It is not an open data catalog (like a government/institutional datasets portal) if your use case is B2B and customer-oriented.
- It is not a data space (a collaborative data ecosystem involving multiple entities, companies, or organizations).
- It is not “just a shared dashboard” with no context, no navigation, no ownership, and no per-entity permissions.
- It is not internal BI: a data portal is designed for external users or distributed networks. Although, taken to the extreme, we could also build a data portal for a department or organizational unit within our company.
Public vs private data portals
A data portal can be public or private. In a public portal, analytical content is exposed and directly accessible (no authentication): anyone can enter and explore dashboards and insights, typically using filters to segment information. In contrast, a private portal requires users to authenticate (usually with username and password) via a login page; once inside, the user can access only the data that corresponds to their entity and permissions.
Public portal
- Everyone sees the same content.
- Segmentation is done using filters (country, industry, period…).
- Ideal for: transparency, aggregated reports, corporate communications.
Private portal (most common in B2B)
- Login and users associated with an entity (customer/partner/branch/franchise).
- The portal enforces data isolation: each entity sees only its own data.
- Ideal for: customer reporting, channel programs, networks/franchises, consultancies delivering portals per client.
Data Portal vs Shared Dashboards vs Embedded Analytics
Comparison table
This comparison often saves many internal conversations (and avoids building “the wrong solution”).
| Option | When it fits | Advantages | Typical limitations |
|---|---|---|---|
| Shared dashboard (link) | You need to share 1–2 specific views | Fast | No end-to-end experience, limited permissions, poor scalability |
| Data portal (website) | External users + white labeling + navigation + per-entity security | Full experience + scalable + governable | If you build it custom, it can be expensive/slow |
| Embedded analytics (in-app) | Analytics lives inside the user’s product/app | Maximum UX integration + workflows | Requires more integration work/roadmap |
Quick rule of thumb
- Use a shared dashboard link or export if you only need to “send a report” as a one-off.
- Use a data portal if you’re sharing data with third parties (customers / partners / franchises) and want a branded web experience.
- Use embedded analytics and integrate visualizations into your application if analytics is part of the flow inside your app.
When to use a data portal
Clear signals
There are a few signals that typically suggest building a data portal:
- Signal 1: you do recurring reporting to third parties
If every week/month someone asks “can you send me the report?”, you’re paying a time “tax” in support, operations, or BI. A portal reduces friction and turns reporting into a repeatable product.
- Signal 2: you need white labeling (it should feel like yours)
When the user logs in, they shouldn’t feel they’re in “another tool.” A portal with your own domain and branding removes that mental context switch and improves adoption.
- Signal 3: you need per-entity data isolation (multi-tenant)
Especially in chains and franchises (by location) and with partners (by account). This is where sharing loose links starts to get risky.
- Signal 4: you want self-service without becoming the “reporting team”
A data portal lets users explore, filter, export, and compare without asking for “another Excel,” reducing tickets and meetings, without handing over the technical responsibility of designing dashboards to a third party.
When NOT to use it (and alternatives)
If the use case is 100% internal (executives, departments, operations teams) and you already have a well-governed BI layer (sources, KPI definitions, controlled access), you usually don’t need an additional data portal. In that scenario, the problem is typically not “where to publish,” but maintaining consistency and adoption inside internal tools.
If, instead, your users already work inside your own software and you want analytics to be perceived as a natural part of the product (same navigation, same screens, actionable data in-flow), the most logical choice is embedded analytics: you integrate visualizations within the app and avoid taking the user to a separate site.
And if you only need to cover a one-off requirement (for example, a monthly report or an ad-hoc analysis), it often isn’t worth spinning up a portal. In those cases, an export (PDF/Excel) with scheduled delivery usually solves the problem with less effort and without introducing a new channel to maintain.
Use cases by company type
Networks and franchises
Each store, branch, or franchisee needs to see its KPIs, and headquarters needs consistency and comparisons. Headquarters creates a data portal where each branch/franchisee logs in and analyzes its own KPIs and even benchmarking of its store versus the rest, among many other examples.
Access to the portal is isolated and secured by role: HQ (global view) vs local manager (day-to-day execution).
Consultancies / agencies
A BI/tech consultancy or an agency (marketing, digital, etc.) delivers branded portals as part of the service (your brand or the customer’s).
Also, if you have templates, you can scale this solution to N clients very quickly, achieving higher ROI with this kind of standardized delivery and improving margins.
This helps you differentiate with a deliverable the customer actually uses, rather than archives.
Startups / scaleups
This case is less common, but sometimes it’s a great option to share data with third parties. Instead of building a platform, you can use a data portal as an MVP to prove value quickly (demos, first customers) without distracting the product team.
This way you increase retention and deliver value to users and customers quickly: when customers see impact, they’re less likely to leave.
Another startup/scaleup use case is building a data portal for the investor board, sharing business performance and keeping the board informed in real time.
Want to see Biuwer in action for your business?
Discover how Biuwer can help your business, from integration to daily use.
Book a demoKey components of a scalable data portal
A data portal that works is not just “a collection of dashboards”: it needs a minimum foundation of experience (UX), branding, security, and operations so you can launch quickly and maintain it as the number of entities (customers, branches, franchises) grows. These 5 components usually make the difference.
1) Navigation and information architecture
A useful portal answers concrete questions. A typical structure:
- Overview (the essentials)
- Operations (what’s actionable)
- Finance (impact and costs)
- Comparisons (if applicable)
2) White labeling
- Domain/subdomain, login page, logo, styles.
- Visual consistency so the user perceives it as “an extension” of your brand.
3) Security (without going into technicalities)
In private portals, the minimum is:
- Roles/permissions (what each user type can see)
- Entity-based access (customer/branch)
- Data policies (so each entity only sees “its rows”)
4) Self-service
- Filters users understand.
- Drill-down into details.
- Governed exports (with date, applied filters, and branding).
5) Operational scalability
- Reusable templates.
- Fast iteration (without relying on development for every tweak).
- Governance: who publishes, who approves, and how KPI consistency is maintained.
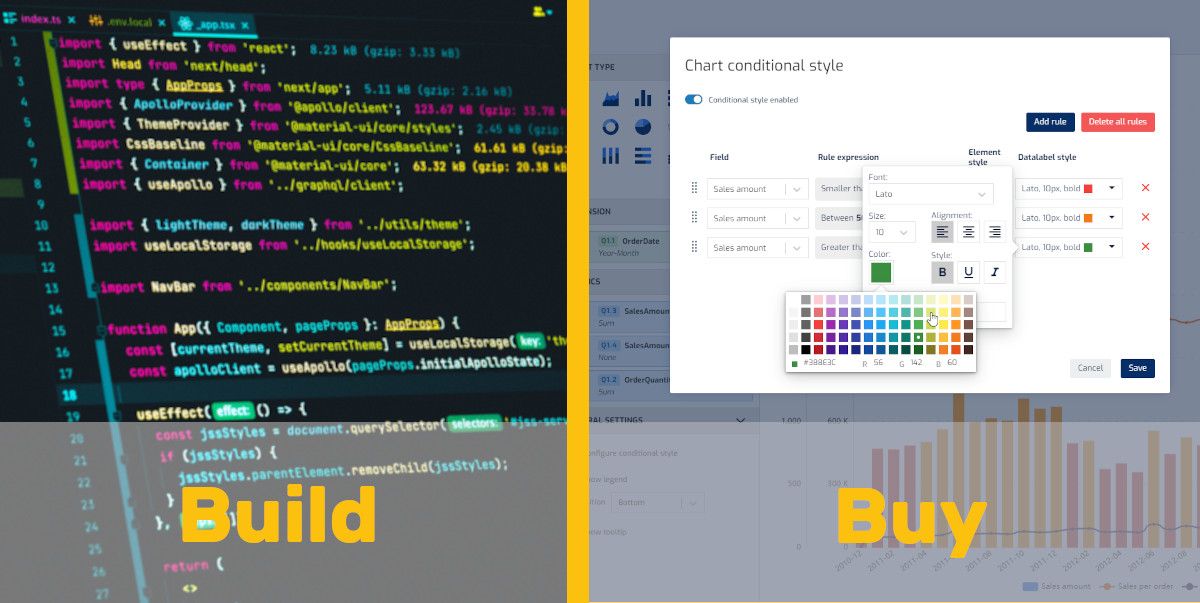
How to launch a v1 data portal without building from scratch
Building a custom data portal is usually bigger than it looks, because it’s not “just drawing charts.” Typically you also have to build (and maintain):
- navigation and frontend,
- login/users (and sometimes SSO),
- roles/permissions + per-entity data isolation,
- connectors/modeling and KPI consistency,
- data refresh/updates,
- hosting, domain, and auditing.
That’s why, to launch quickly and without adding security risk, it’s common to start from a platform that already solves white labeling + access control + scalability and focus on what really creates value: which dashboards/insights and structure the user needs.
Practical checklist: the minimum that should exist
Before you start building your data portal, this checklist helps you define the v1 scope and avoid the two most common mistakes: trying to do too much on day one, or leaving security and structure until the end. If you meet these points, you’ll have a solid foundation to launch, measure adoption, and iterate.
- Goal (1 sentence): what decision/action the portal enables.
- Primary entity: customer / branch / franchise (pick one).
- Roles: 2–3 roles (HQ / Manager / Read-only).
- Home: 5–7 KPIs and links to drill-down.
- Navigation: 2–3 clear sections (Overview, Operations, Finance…).
- Definitions: glossary or tooltips for critical metrics.
- Basic self-service: 2–3 key filters + 1 export (PDF/Excel) with date and applied filters.
- Branding: logo + colors and, if applicable, domain/subdomain.
- Freshness: visible “last updated.”
Real example: private portal for industrial energy management
An energy management company (industrial sector) needed a private portal to continuously communicate branded data to its customers (without manual reports).
Context
- Users: industrial customers and location managers.
- Entity: customer / plant / location.
- Goal: each customer sees consumption, distribution, and trends over periods, plus the status of connected devices.
What was shown in v1 (by section)
- Overview: main period KPIs (total consumption, change vs previous period, peaks).
- Consumption by periods: date-range filters and comparisons.
- Energy distribution: breakdown by equipment/areas per installation.
- Connected devices: inventory, status (active/inactive), and last received data.
Why the “portal” format was key
- Isolation: each customer/location only sees its data.
- Context: menus and sections aligned with real user questions.
- Scalability: as customers grow, the portal remains manageable (roles/permissions + reusable structure).
Biuwer Data Portal
If you made it this far, the concept is clear. The usual question is how to launch it without turning it into a long development project.
Biuwer is built to design and deploy dashboards and data portals on a secure, cloud, No-Code platform, with white labeling and access control.
How to create a data portal in Biuwer
Assuming you’ve already built the visual layer in Biuwer (pages or dashboards), creating a data portal takes less than 5 minutes. In summary, these are the steps:
- Create a data portal from the Biuwer UI.
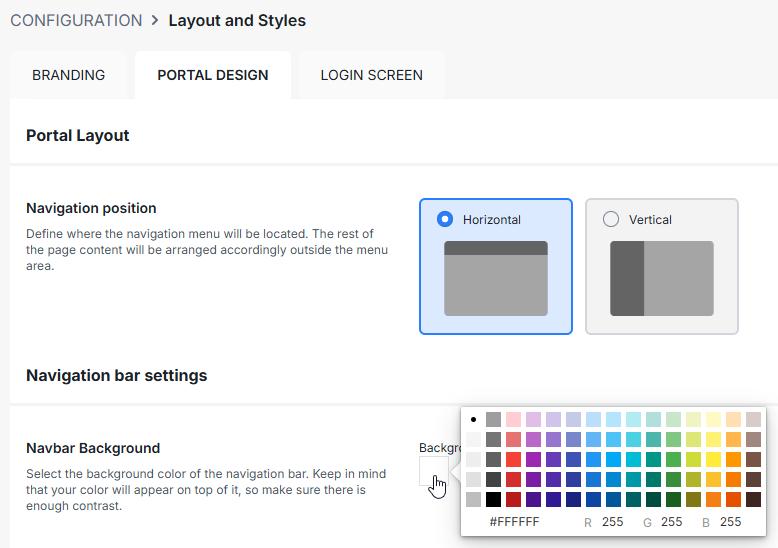
- Configure domain and white labeling (branding).
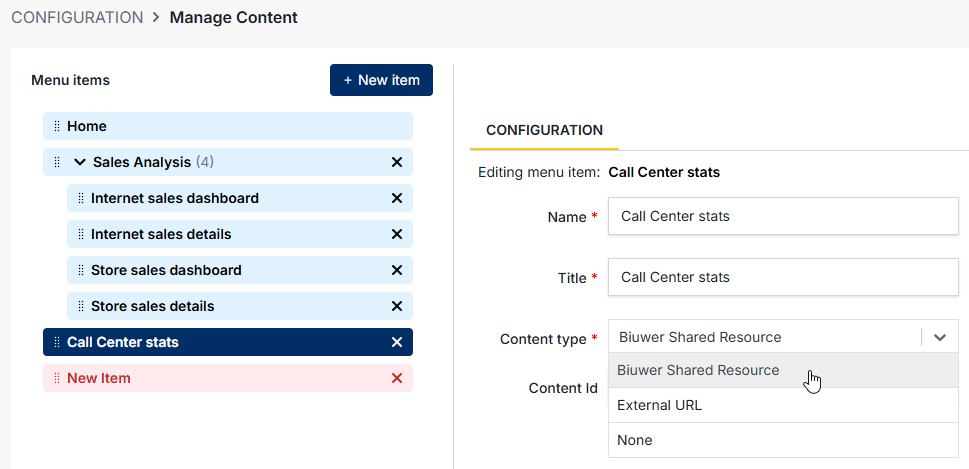
- Define a navigation tree (menus and sections).
- Add content such as dashboards and insights.
- Configure the users who will have access to the data portal. Data security is managed internally in Biuwer through Data Policies, which simplifies the overall setup.
Want to see a white-labeled data portal with access control in action?