February 28, 2020
February 2020
New functionalities:
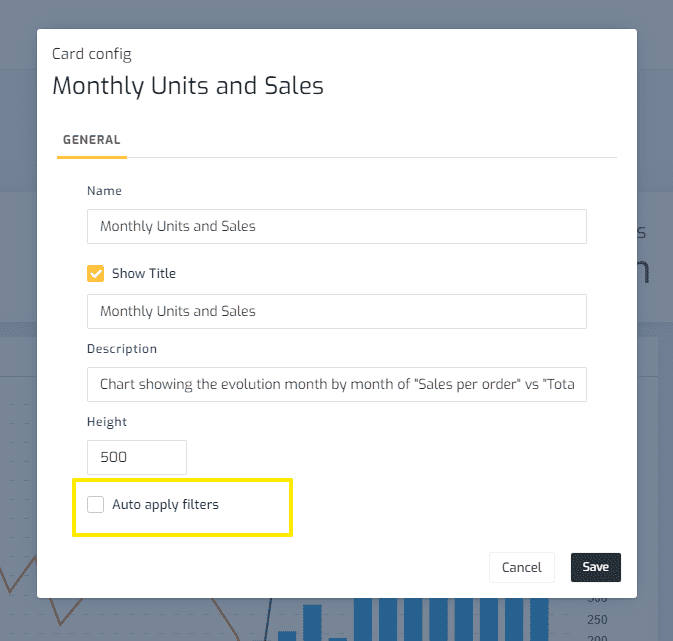
- Automatic execution on cards: Added the option “Auto apply filters” to execute the data query on a card when it is being viewed individually.

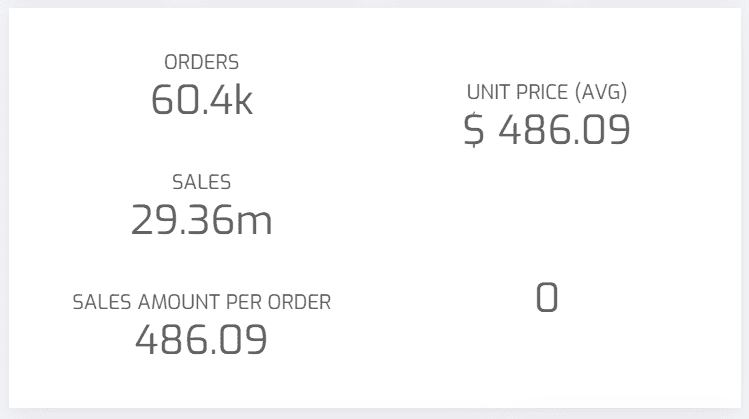
- Data visualizations - KPI cards: Added the functionality to create cards that support more than 4 indicators. Until now the maximum number of indicators was 4 per card. Now you can add as many indicators as needed in each area of the card.

- Website: Pricing plans are added on the website.
- Website: A new blog section is created on the Biuwer website.
Bug fixes:
- Data visualizations - Vertical tables: Fixed a problem with the inclusion of a second vertical scroll bar that appears when the option to show the number of records obtained is activated.
- Data Visualizations - Vertical Tables: Fixed problem when using interactive value filtering on columns with date type fields and with empty values.
- Data Visualizations - KPI card: Fixed problem when applying conditional formats when the indicator has a value equal to zero.
- Data Card Editor: Fixed an issue when editing a card and changing the data model of the query causing the fields on the visualization tab not being cleared.
- Minor fixes


