June 30, 2023
June 2023
New functionalities:
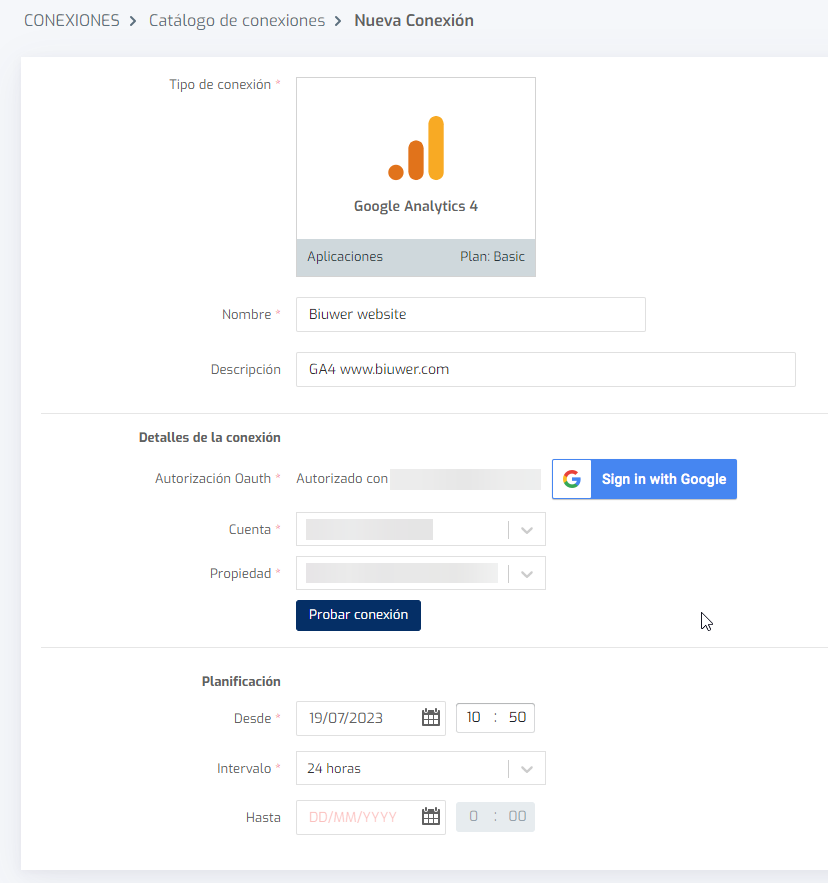
- New Google Analytics 4 (GA4) data connector. As you know, since July 1, 2023, Google has stopped processing data from Google Analytics 3 (Universal Analytics) accounts. With the new Google Analytics 4 connector, you can now connect your Google Analytics accounts to Biuwer, so that the data is automatically synchronized and you can analyze it however you want, alone or in combination with other data sources. The connection configuration is just as simple as usual in Biuwer, as you can see in this screenshot.
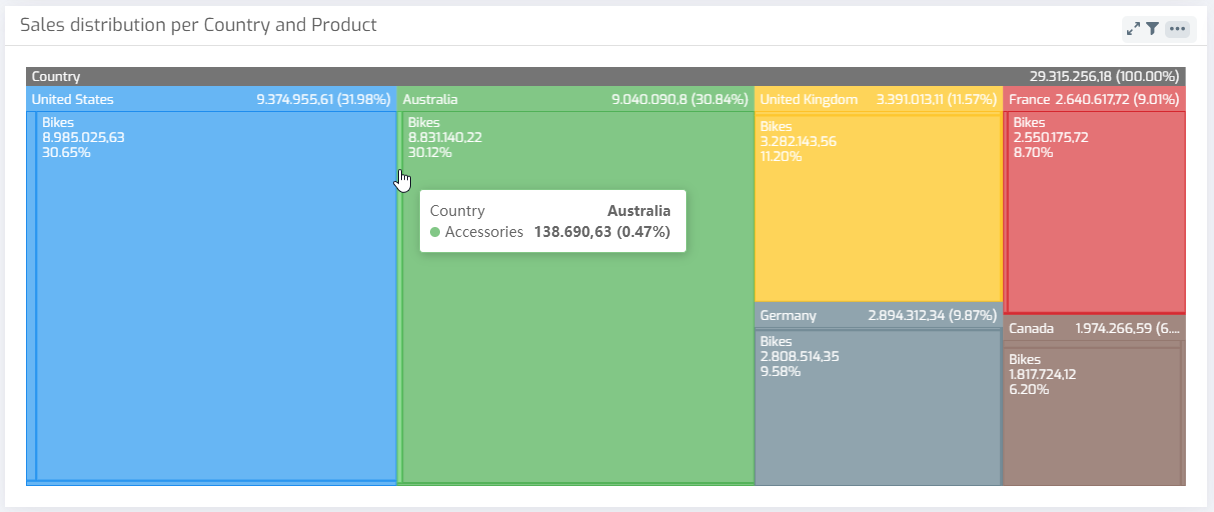
- New Treemap chart type. This is a very useful chart to visualize how the values of a metric are distributed in an area, with one or two dimensions. For example, the breakdown of the amount of sales by country and product category, as shown below:
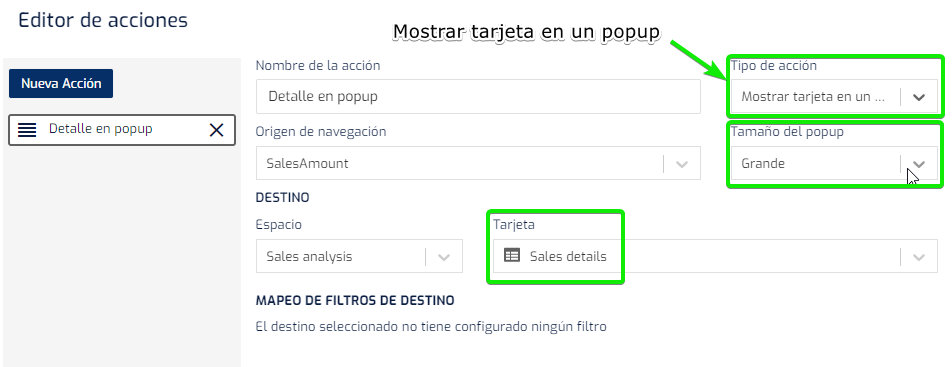
- New action to show a card in popup. This action allows any card to show another in a popup or overlay. This new type of actions allows you to implement things like seeing a detail from a KPI, a chart, a table with aggregation, etc. From the "Actions" menu of the card:
- The action system is now available on Chart Cards. Since this version, charts include navigation to other pages, cards, external URLs, and popups, like other cards. Soon a contextual menu will be enabled to show the user the configured actions to choose which one to launch.
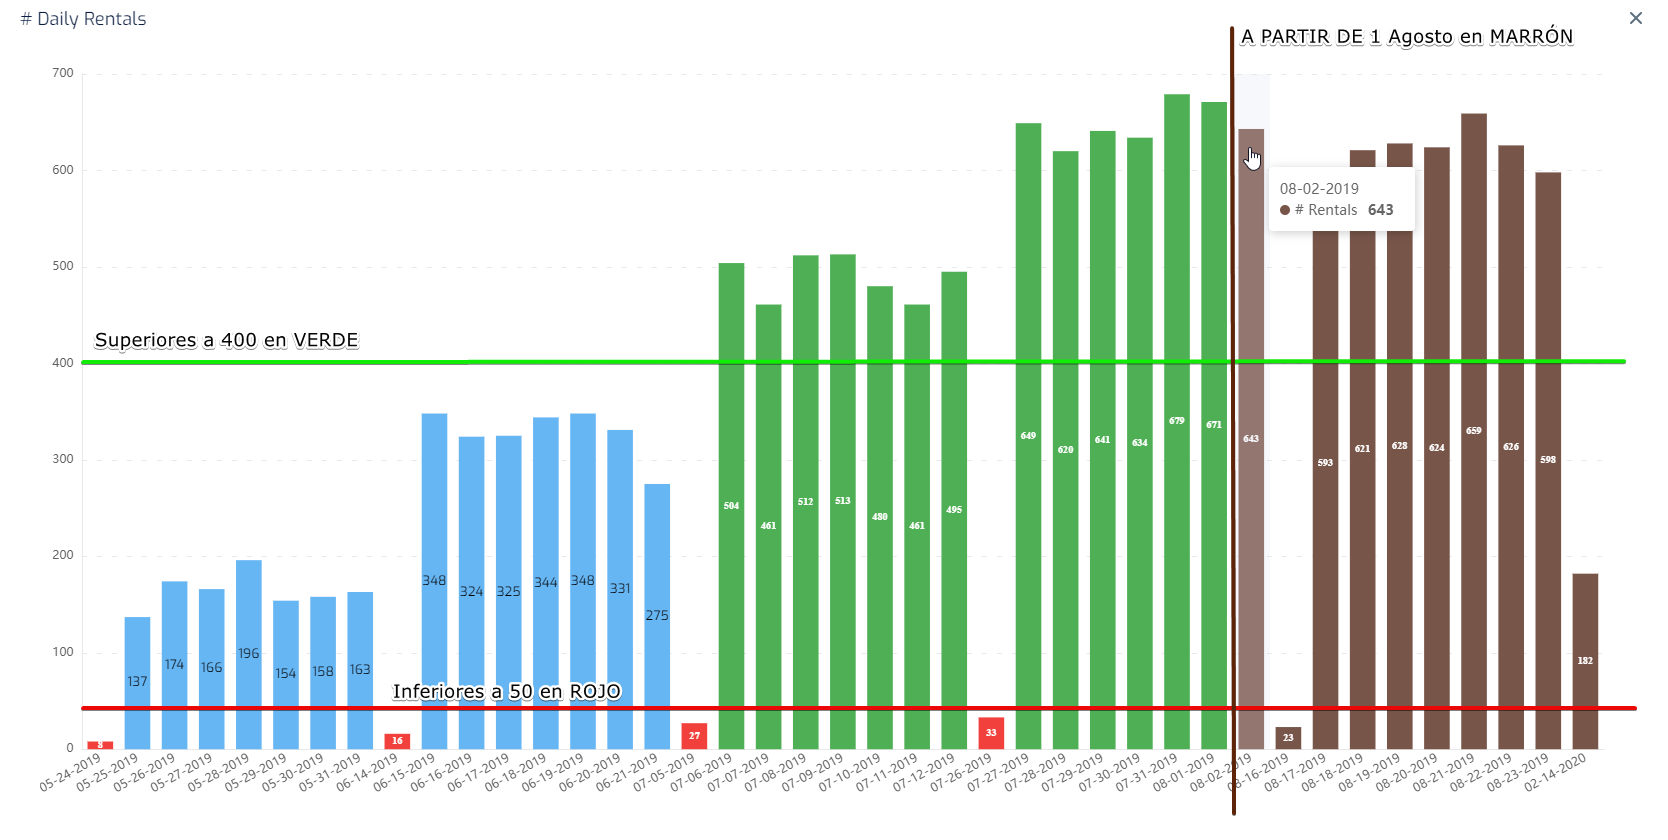
- Conditional styles are now available in Chart Cards. Since this update, charts include conditional styles based on chart type. The possibilities are quite powerful. Below is an example, where blue is the original color of the series, and conditionally, it shows: in green the values greater than 400, in red the values less than 50 and in brown the values for dates greater than 1 of August.
Improvements:
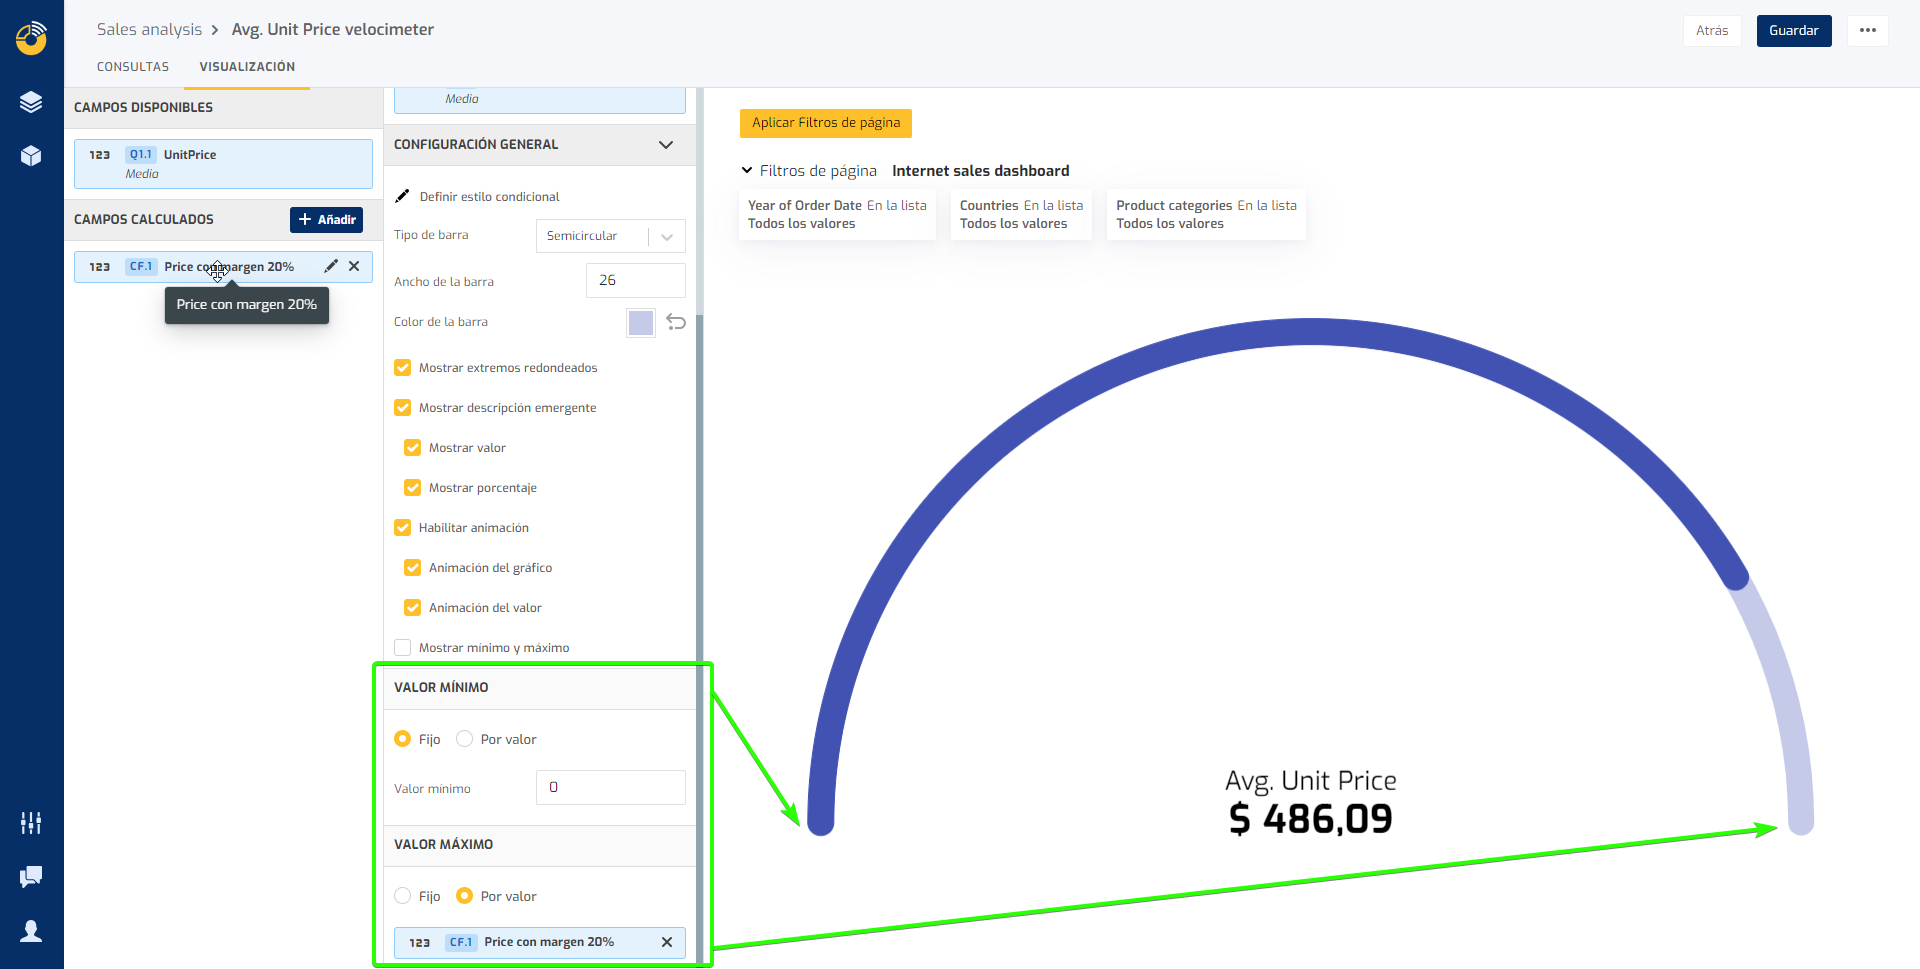
- You can now use a data field to specify the minimum and maximum values in Speedometer Charts. It is useful for cases in which you want to dynamically compare the value of a metric against a target, defined in another data field or in a calculated field.
- We've improved the Data Sets list so you can filter them better, access context menus more easily, and we've removed unhelpful information.
- We have improved the Page creation flow, to specify the title initially. This prevents multiple pages from being created "by mistake".
- We have added a help button in the Card Calculated Fields creation and editing dialog, within the Data Cards Editor. With this button you can quickly access the Biuwer help page, to consult the available functions and how to use them, with examples.
- We've slightly expanded the custom value sort dialog in the Data Card Editor. In this way, the values with the most available space are displayed when sorting them by the criteria you need on the screen.
Bug fixes:
- Fixed cases where data labels were displayed below bars on stacked bar chart cards.
- Date filter operations have been adjusted for the Clickhouse connector.
- When switching a chart card between different types, those chart types that do not have a legend available are taken into account and not displayed.
- The number formats configured in the Organization or User are applied in various chart types.
- Other minor fixes.


