On average, a company uses about eight different applications to manage its day-to-day operations and spends 40 hours a month on the data management and reporting process. If you do the math on how much money and human resources we are spending, it is something to try to simplify at all costs. Data automation serves to simplify and save resources in the whole process of managing and analyzing data in your company.

Source: Freepik (www.freepik.com)
We live in a world in which the generation of new data is increasing (in fact it tends to be exponential), and if we stop for a moment to think, each of us carry 'smart' devices that do just that, generate data, from smartwatches or smart watches, to your own mobile device. And this is something that is also happening in the business world, even on an even larger scale.
Companies that aspire to be modern and make decisions based on data (and not on intuition), the so-called "data-driven companies", suffer from this problem every day. When we want to make decisions about the data that our company is generating, we can ask ourselves the following question: what types of data are we generating?
On average, a company uses about eight different applications to manage its day-to-day operations. Do you think that's a lot, let's do the math with some examples: Is your company present in social networks? Each of these profiles are data that can be analyzed; Do you use a tool for invoicing and accounting? it adds a source of data to our accountant; Do you run online advertising campaigns? If you have a sales team you are probably using a CRM; And of course you will be registering the visits to your website using Google Analytics (or a similar alternative).
These are just a few examples and as you may have noticed, our company is a machine that generates data. It would be great to be able to transform all this into value, wouldn't it? Remember that data is the gold of the 21st century, so we must be ready to take advantage of it. How? By making decisions that make us sell more, that allow us to reduce costs, reach new markets and customers, focus on a geographic area with greater demand, target the type of customer who is willing to buy our product, and so on and so forth.
I have bad news and good news for you. The bad news is that this does not end here, the volume and heterogeneity of data will not stop growing, so it is necessary to put an order in the management and analysis of these data. The good news is that there are more and more tools and platforms that facilitate this type of tasks.
Let's take the example of an online store
An online store is not very different from a company that sells in a physical store, but it is likely to be generating more data and that is why this example is even more interesting for this type of company.
Owning an online store involves a lot of work: marketing, communication, legal compliance, order management, shipping, deliveries, returns, etc. And as the company grows, data analysis is essential to make all these processes more efficient and obtain better results.
What does data analysis allow for in an online store?
Data analysis in an online store tries to collect and interpret all the information collected in the different digital tools used by the company on a daily basis, in order to know in depth each of the pieces or gears of the company.
For example, after performing the analysis on your website with Google Analytics, you will obtain very relevant information about consumer behavior and consumption trends, such as demand, loyalty, most visited pages, etc.
At this point you will be thinking that you can do all this by accessing Google Analytics, the control panel of my online store, each of the social networks, the billing system you are using, the control panel of stripe or prestashop, the control panel of Google Ads, etc. And of course using one of the best data management tools, which is the well-known Excel.
And this is where the time factor comes in, did you know that on average a company spends more than 40 hours a month on the data reporting process? If you have to access and visualize the data in each of these tools separately you can spend even more time, and more importantly, you will probably end up not doing it.
For this reason it is important to automate the data and be able to synchronize them in a single platform, as this will allow you to have a global picture of what is happening in your company and to be able to react in time by making valuable decisions.
The importance of data analysis
A successful eCommerce Analytics strategy is not about collecting all the data and campaign metrics, it is about understanding that data and transforming it into information to make the right decisions for the business.
Knowing the data in depth will allow you to understand each person who passes through your online store. In this way, you will be able to design and adapt your marketing actions to each of your consumers.
On many occasions, companies jump into the void and invest large amounts of money in marketing actions in the hope of achieving success in sales, and when analyzing the results over time they find that the return on investment (ROI) is low or even negative.
To prevent this from happening, it is advisable to analyze the performance of each of these campaigns and see how it is impacting our business. That is why it is important to synchronize and automate data from all the tools in order to know what is happening and what are the results so far.
5 reasons to automate data analysis
One of the main problems for both data analysts and marketers is the constant struggle between time spent and manual effort to organize all the data and analyze it in visualizations and dashboards. The ultimate goal is to make smart decisions based on data.
The modern world moves so fast that we can't afford to wait weeks for someone to check a spreadsheet to find out how their campaign is doing or the evolution of sales generated.
So why should I automate my data analysis process?
1. Saves time and effort in preparing data manually
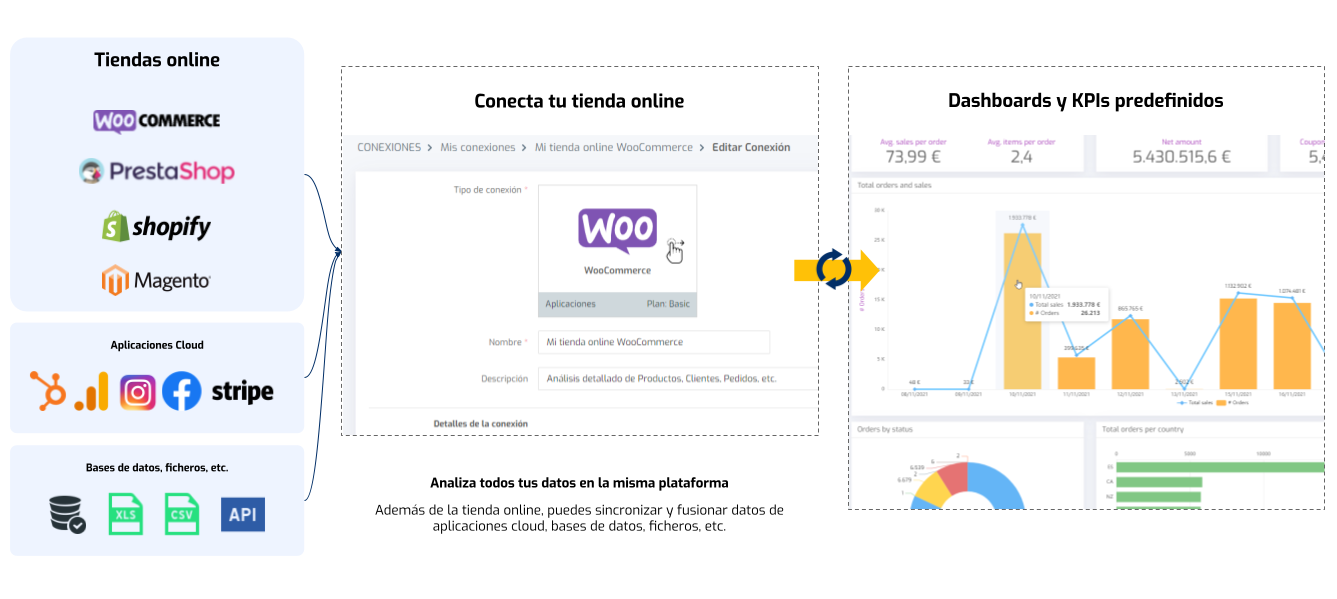
Automation starts with the process of synchronizing and updating data. We usually have several sources of data, so we must use a tool that allows us to put this process "on autopilot". This tool should extract the data from each of our applications to a centralized location, so we will have all the data updated and available to be analyzed at any time through dashboards or any other type of data visualization.
In the following diagram you can see an example for the case of an online store. For example if you have an online store with Prestashop, WooCommerce, Shopify, etc. you can synchronize this data with Google Analytics, Facebook Ads and Google Ads and you can track which campaigns have been more profitable and see how it is directly impacting the results of your online store.
The direct benefit is the time savings, on average about 40 hours per month for a qualified person and, depending on which tool you use, this benefit will be double, since if the data analysis tool has predefined automations, the time savings is both in the implementation phase and in the daily use when making decisions.
It must be taken into account that traditionally a Business Intelligence project, in which this type of task is performed, can take weeks of work, normally dedicated by professionals or companies specialized in this sector, which implies an economic and temporal cost.
2. Avoids possible errors
The tasks that people perform are susceptible to errors and even more so when it comes to managing and automating data. Imagine that you have to perform the data loading process manually, access the X application daily, export the data to excel, check it and prepare it for uploading to a data visualization platform. In this chain of tasks it is possible that a person may be careless or apply an incorrect formula and from that moment on these data will no longer be correct and may lead to a misinterpretation of the data.
Data automation helps to avoid human error. Once the automation is configured and validated, your concern should be on making decisions and correctly interpreting your company's data and not on checking if a mistake has been made in the upload process.
3. Unify all data sources in one place
One of the main problems for companies when analyzing data is to be able to integrate all data sources on the same platform. Different tools for analysis, a lot of data and many hours to be able to produce a complete report with the results.
It is important to know the term single version of the truth (SVOT). That is to say, that we rely on a single place when making decisions, since it is important to have all the data in one platform and not scattered in several. This way the decisions we make in our company will be based on unified data and we will avoid other people misinterpreting our data. For example: if you share an excel file with a monthly sales report, which version is the correct one, in which file are the latest modifications?
4. Keep the history of your data
Do you own all your data? Did you know that the tools you use in the cloud usually have a limited data history? Let me give you an example: the winter sales season is approaching and you want to see the results of the campaign from 2 years ago in Google Analytics to see how it worked. If you don't have the data saved, you won't be able to see the results because this cloud tool has a limited time to save them.
The case of Google Analytics is a clear example that historical data matters, so it is recommended that we keep it. If the automation saves the information in a database, we will have all the historical data stored, so we will be able to perform trend analysis with respect to other periods of time.
5. Make high-value decisions
Although it may seem obvious, we can make bad decisions. Sometimes it happens, it is purely a matter of statistics. But if we carry out a correct data automation process, the probability of making an incorrect decision will be considerably reduced because we have the right information to avoid reaching this point.
In addition, the fact that we have data from different data sources in a single platform opens up many possibilities to have updated indicators.
An example of this can be seen in the article The 20 most important KPIs in eCommerce for sales growth. And there are indicators, which for its calculation we need data from different places, such as the conversion rate, which we need the total visits (Google Analytics) against the sales made (online store) in a given period…
Biuwer: The tool that puts your data on autopilot
If you have come this far, it is because you feel identified with this problem and it is something you are interested in solving in your business.
I want to tell you about Biuwer, our data analysis platform, which emerges as a Business Intelligence platform with which you can analyze data through dashboards, reports, maps, tables or graphs.
Biuwer has a series of connectors and integrations to cloud applications, as well as the possibility of uploading files, excel, CSV or JSON. Through these connectors Biuwer automates and synchronizes data quickly and easily, in a matter of a few clicks, creating for you a series of predefined visualizations and dashboards, which you can later modify if necessary.
In addition, with Biuwer you can create your own dashboards and data visualizations from scratch, with a user-friendly interface and no technical knowledge required, using any of our data connectors, including connections to databases such as PostgreSQL, MySQL, Oracle, etc.
Want to learn more about how to analyze data in your company and achieve better results? Our team of specialists will be happy to assist you in a personalized demo.