No-code content builder
Create responsive pages, dashboards, cards and collections through a visual interface.
BIUWER ANALYTICS
Create dashboards, embed them in your product, launch branded data portals and control access from one governed platform.
30-day free trial · No credit card required
ANALYTICS CAPABILITIES
Build, model, govern and deliver analytics for internal teams, applications and customer-facing data portals.
Create responsive pages, dashboards, cards and collections through a visual interface.
Add filters, actions, multi-query analysis and reusable visualizations for self-service exploration.
Integrate analytics into your software with secure embedding, APIs and a JavaScript SDK.
Publish branded analytical experiences for customers, partners, franchises or business units.
Control access with roles, groups, object-level security, row-level security and audit logs.
Isolate data and experiences by customer while managing everything from one platform.
Adapt colors, styles, messages and multi-language content to each experience.
Connect business data, upload files and automate integration through public APIs and custom connectors.
NO-CODE CONTENT EDITOR
Biuwer Analytics organizes content into a clear structure. Spaces group each analytical context, Pages compose complete experiences and Cards provide reusable visualizations and analysis units.
EMBEDDED ANALYTICS
Embed dashboards and visualizations without sending users to another tool. Apply your branding, security model and customer context while Biuwer handles the analytics layer.
INTERACTIVE FILTERING
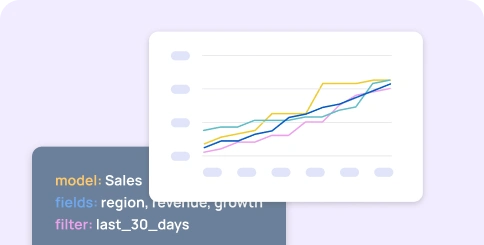
Configure dynamic filters on Pages and Cards and decide which queries and visualizations they affect. Users can explore data without changing the underlying analytical model.


DATA CENTER
The Data Center provides a governed layer between source systems and analytical content. Combine data managed by your organization with data managed in Biuwer.

SECURITY AND ACCESS CONTROL
Control access through Users, Groups and Roles, combining inherited permissions with individual rules. Data Policies add row-level security without duplicating Pages or Cards.


EXPORT AND SHARE
Export the results displayed in Pages and Cards when teams need to share, archive or continue working with analytical information outside the platform.

See Biuwer Analytics with your own use case
Book a personalized session and discover the fastest path to your next dashboard, embed or data portal.
Resources
Contact
2026 © Biuwer Analytics S.L. - All Rights Reserved.
Supported by: