The acquisition of a technology platform inevitably raises questions among its customers. Will the product continue? Will its features change? Will integrations need to be modified? Will the same commercial terms remain in place?
These questions are especially relevant when the acquired tool is part of the experience a company delivers to its own customers.
On October 22, 2025, Omni announced the acquisition of Explo, a platform specializing in customer-facing analytics and embedded analytics. Omni also announced its intention to move most Explo customers to its own platform and gradually retire the Explo product.
For current customers, this means that at some point they will need to review dashboards, data models, permissions, integrations, and contractual terms.
Omni may be a suitable option for organizations looking for a broad analytics platform with semantic modeling, business intelligence, artificial intelligence, and the ability to address complex use cases. But not every company needs that breadth of functionality.
For some SaaS teams, software companies, or technology service providers, a broader platform may also involve greater implementation, learning, administration, and cost complexity.
That is why, before assuming that the natural migration path from Explo must be Omni, this is a good time to review the market and compare alternatives such as Biuwer Analytics.
What changes for Explo customers?
Omni has stated that Explo will continue operating during the transition period and that it will work with customers to plan their migration. This transition period is expected to end on December 31, 2026.
According to the information published by Omni:
- Explo has become a wholly owned subsidiary of Omni.
- Most customers will need to migrate to the Omni platform.
- There may be functional differences between the two platforms.
- Omni will provide guides, tools, and individual support to facilitate the transition.
- The Explo platform will be gradually retired.
- Current pricing will remain in place only until the existing contract expires.
- Before migration, each customer will receive a new commercial proposal for Omni.
This does not necessarily mean that the transition will be negative. Omni is committing resources and support to reduce the impact of the migration.
However, it does mean that customers need to reassess a decision they probably considered settled: which platform they should use to deliver analytics to their users over the next few years.
Migration is not just a technical change
Changing an embedded analytics platform is not simply a matter of recreating a few charts in a different tool.
A customer-facing analytics solution is usually connected to multiple layers of the product:
- Data models and connections.
- Dashboards and visualizations.
- Filters and parameters.
- Authentication.
- Roles and permissions.
- Data separation between customers.
- Embedded components.
- Visual customization.
- Etc.
Even when the vendor provides migration tools, the team must verify that the new platform behaves in a way that is equivalent to the previous one.
It must also confirm that the new product still fits its strategy, budget, and available technical resources.
For that reason, a mandatory migration can become an opportunity to reassess the use case from the ground up.
Omni pricing may become a decision factor
One of the areas Explo customers will need to review is pricing.
Explo's public pricing page listed its Pro plan starting at $1,995 per month, including white-label embedded dashboards, unlimited creators, and a tiered model based on customers.
Omni, by contrast, does not publish an equivalent standard price for Explo customers on its transition page. The company states that it will maintain existing pricing until the current contract expires and will present a new commercial proposal before migration. This does not mean that Omni will be more expensive for every customer. Pricing will depend on each company's contract, users, features, volume, and negotiation, but there is genuine commercial uncertainty.
In addition, based on real market evaluations, some companies that have completed demos, as well as others we have interviewed, report that an annual Omni plan can easily exceed $30,000. This is not an official figure and will not apply to every case, but it reflects a relevant market perception that should be considered during the evaluation process.
Omni is a broader platform than the traditional Explo product. It includes internal BI, semantic modeling, embedded analytics, artificial intelligence, and tools for addressing complex analytics scenarios.
Complexity should also be part of the evaluation
The second factor is ease-of-use complexity.
Omni is designed to cover broad analytics use cases. Its offering includes a semantic layer, modeling, analysis using SQL, formulas, spreadsheets, visual interaction, and artificial intelligence.
This flexibility can be highly valuable for advanced data teams.
However, in practical evaluations, some teams that have tested Omni say that the platform can feel more intricate or complex than Explo. Although it offers significant flexibility, it does not always maintain the same level of simplicity in the user experience that characterized Explo.
What to evaluate before accepting an automatic migration
Before committing to Omni or any other platform, we recommend reviewing seven areas.
1. The primary use case
Not every analytics tool is optimized for the same purpose.
It is important to distinguish between:
- Internal business intelligence.
- Dashboards embedded in a SaaS product.
- Customer reporting.
- Data portals.
- Analytics for partners or distributors.
- Reporting for franchises or multiple locations.
- Advanced exploration for analysts.
- Self-service analytics for end users.
A company may need one of these models or a combination of several.
The goal is to determine which use cases truly matter and which capabilities are secondary.
2. The embedded experience
If dashboards are part of the product, they should feel like a natural extension of the application.
Key areas to evaluate include:
- Customization of colors, typography, and components.
- Integration with the existing navigation.
- Responsive behavior.
- Interaction between the application and the dashboard.
- Dynamic filters.
- Use of iframes, web components, or an SDK.
- Session management.
- Load times.
- Content updates without new software deployments.
It is not enough to confirm that a platform can embed a dashboard. The full experience delivered to the user must be validated.
3. Security and multi-tenant architecture
In a SaaS application, each customer must be able to access only its own data.
The platform should make it possible to control:
- Roles and groups.
- Dashboard access.
- Object access.
- Row-level security.
- Organization-level security.
- User-level permissions.
- Access tokens.
- Traceability.
- Exports.
- Tenant separation.
An incorrect configuration can create serious security issues. For that reason, multi-tenant architecture should not be added later as an adaptation: it should be part of the platform's core design.
4. Ease of creation and maintenance
An embedded analytics implementation does not end when the first dashboard is published.
Over time, new metrics, customers, filters, products, and requirements appear.
Questions to ask include:
- Who can create dashboards?
- Is writing code required?
- Does every change require engineering involvement?
- Can analysts work independently?
- Can components be reused?
- Can content be updated without deploying a new product version?
- What is the learning curve?
- How long does it take to onboard a new user?
Reducing technical dependency is one of the factors with the greatest impact on the total cost of a platform.
5. Data Portals
Not every external user accesses the company's main application.
In some cases, it is necessary to provide an independent environment for:
- Customers.
- Partners.
- Suppliers.
- Distributors.
- Franchisees.
- Locations.
- External teams.
- Public bodies or partner organizations.
Building that portal from scratch may require authentication, navigation, branding, permissions, and maintenance.
It is therefore important to check whether the platform can create complete data portals or whether it only provides dashboards for embedding.
6. Total cost and ability to scale
The budget should be calculated using a realistic scenario.
For example:
- Current number of customers.
- Expected number of customers in 12, 24, and 36 months.
- Number of internal users.
- Number of external users.
- Expected query volume.
- Additional environments.
- Support requirements.
- Integrations.
- Professional services.
- Cost of the internal team required.
It is also important to understand which variable drives price increases.
A tool that is affordable at the beginning can become difficult to sustain if its cost rises quickly with every new user, customer, dashboard, or query.
7. Migration effort and risk
A proof of concept should reproduce a real use case.
It should not be limited to connecting a table and creating a chart.
It should include:
- A representative data source.
- A real data model.
- One or more existing dashboards.
- Multi-tenant security.
- Authentication.
- Brand customization.
- Integration into the application.
- Performance.
- Required exports.
- Validation with internal and external users.
Only then can the migration effort be estimated accurately.
Biuwer Analytics as an alternative to Explo and Omni
Biuwer Analytics is a cloud-based no-code Business Intelligence, embedded analytics, and data portal platform.
It is designed for companies that need to create, manage, secure, and deliver analytics experiences to internal teams, applications, customers, partners, or external users. Ease of use is a foundational principle of its architecture, while the platform is still equipped to address complex, enterprise-ready use cases.
Its value proposition is built around three main usage models.
Internal Business Intelligence
Teams can create interactive dashboards and manage metrics through a visual no-code interface.
This makes it possible to replace manual reporting, centralize KPIs, and reduce dependence on continuous development cycles.
Embedded Analytics
Software companies can integrate dashboards and visualizations into their own applications.
Biuwer offers different integration options, including iframe, API, and JavaScript SDK, depending on technical requirements and the degree of customization needed.
Data Portals
Organizations can create independent, branded environments for sharing analytics with customers, partners, suppliers, franchises, or locations.
This makes it possible to deliver a complete analytics experience without having to build authentication, navigation, and portal structure from scratch.
An alternative designed to reduce complexity
Biuwer is designed with a no-code approach. Dashboards, pages, visualizations, filters, and content can be built through a visual interface. Developers retain API and SDK integration options when required, but they do not need to be involved in every content change.
This model makes it possible to distribute responsibilities:
- Data teams manage models and metrics.
- Analysts create and maintain dashboards.
- Product teams define the experience.
- Developers implement the initial integration.
- Business users can access information without using technical tools.
Compared with platforms designed to cover very broad analytics ecosystems, Biuwer focuses on simplifying analytics delivery.
It is not intended to be the right solution for every scenario.
It may be especially suitable when the main goal is to deliver dashboards, embedded analytics, or data portals without scaling engineering complexity at the same pace.
A More accessible and transparent pricing structure
Biuwer publishes starting prices for different usage levels.
At the time of writing:
- The Basic plan starts at €60 per month.
- The Standard plan, which includes embedded analytics, data portals, RBAC, OLS, and RLS, starts at €240 per month.
- The Professional plan, which adds the JavaScript SDK, API, professional connectors, and advanced customization, starts at €600 per month.
- The Enterprise plan is configured through a custom proposal.
These figures should not be compared directly with an Explo or Omni proposal without analyzing the full scope.
Each vendor may include different users, capabilities, volumes, services, and terms.
However, having public starting prices allows companies to estimate the order of magnitude of the investment before entering a commercial negotiation.
For small and mid-sized SaaS teams, consultancies, or companies that want to begin with a specific use case, this accessibility may be an important factor.
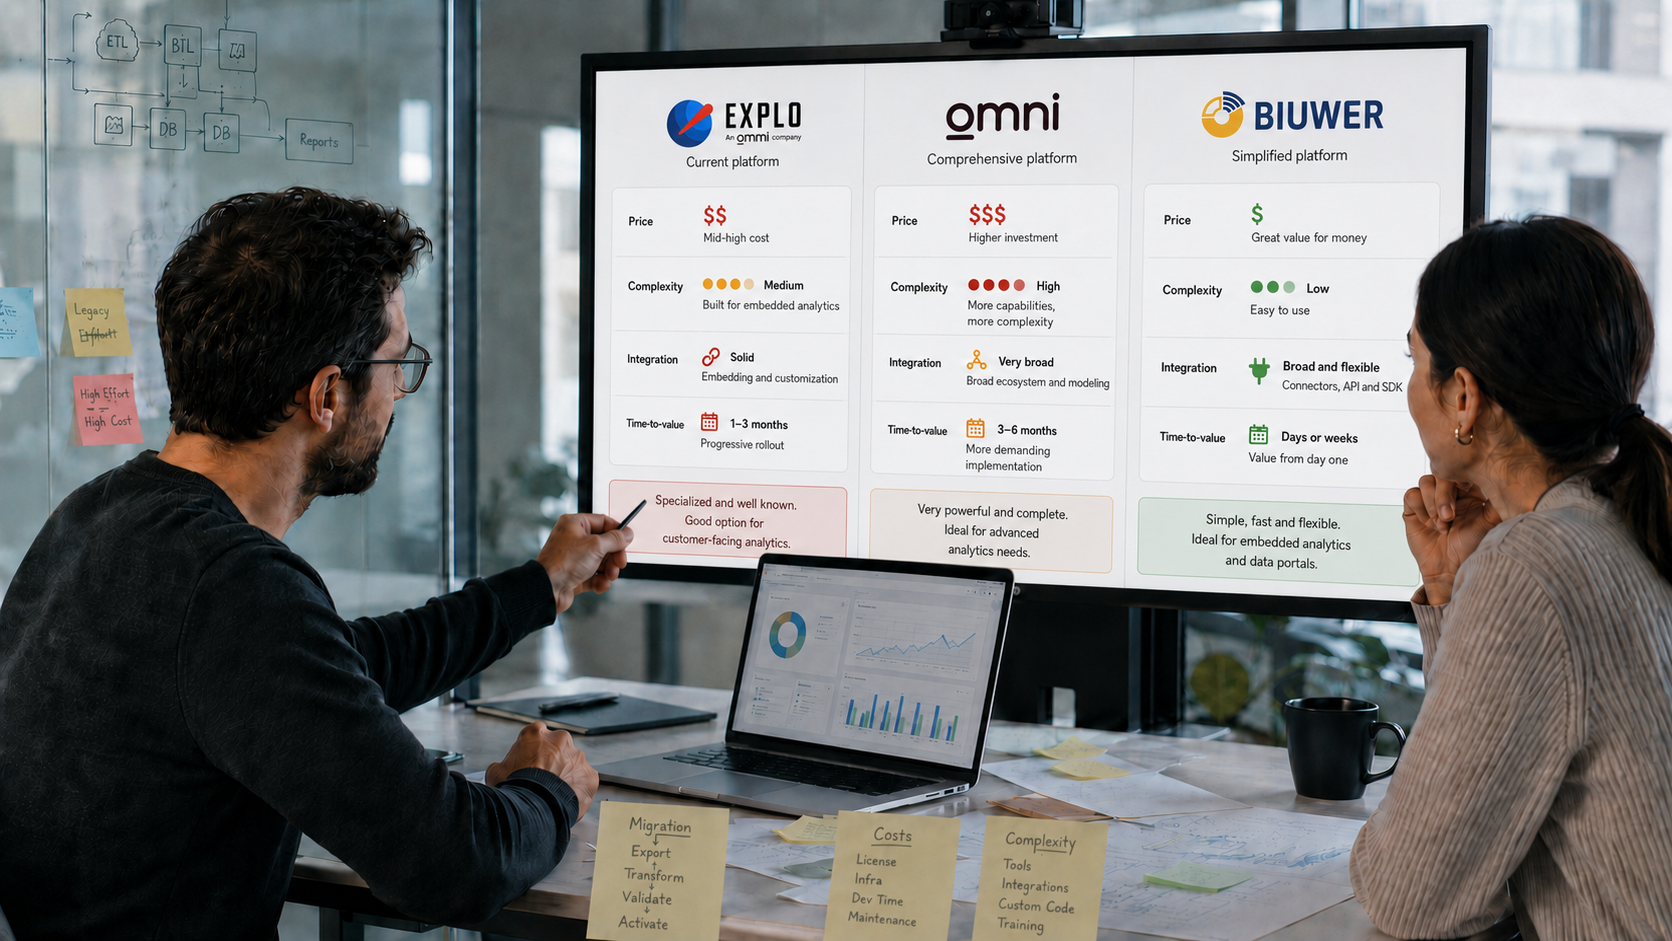
General comparison: Explo, Omni, and Biuwer Analytics
| Criterion | Explo | Omni | Biuwer Analytics |
|---|---|---|---|
| Status | Product in transition following the acquisition | Destination platform proposed for most Explo customers | Independent platform |
| Primary focus | Customer-facing analytics and embedded dashboards | Broad platform for BI, modeling, AI, and embedded analytics | No-code BI, embedded analytics, and data portals |
| Functional complexity | Specialized approach | Greater analytics breadth and depth; may be perceived as more complex | Visual, no-code approach designed to simplify analytics delivery |
| Visual creation | Yes | Yes, alongside SQL, formulas, spreadsheets, and AI | No-code drag-and-drop builder |
| Embedded analytics | Yes | Yes | Yes |
| Internal Business Intelligence | Not its main focus | Yes | Yes |
| Data portals | Available in selected plans | Must be validated for the specific use case | Core platform capability |
| White-label | Yes | Required scope should be validated | Yes |
| Multi-tenancy and security | Capabilities focused on customer-facing analytics | Managed through models, permissions, and attributes | RBAC, OLS, RLS, and account-level data separation |
| Integration | Embedding tools | Embedded analytics, APIs, and other capabilities | iframe, API, and JavaScript SDK |
| Public pricing | Pro plan starting at $1,995 per month | Custom commercial proposal; some market evaluations place certain contracts above $30,000 per year | Starting at €240 per month for Embedded Analytics |
| Likely fit | Companies already using Explo during the transition period | Organizations with broad, complex analytics requirements and advanced data teams | Companies prioritizing ease of use, speed, no-code, data portals, and cost control |
The table is for guidance only. Before making a decision, each company should validate features and limits directly with the vendors.
Looking for a simpler, more flexible, and predictable way to deliver analytics to your customers? Book a Biuwer Analytics demo and evaluate your use case with our team.